
https://www.ncbi.nlm.nih.gov/pmc/articles/PMC5986486/
Effect of Dietary Sugar Intake on Biomarkers of Subclinical Inflammation: A Systematic Review and Meta-Analysis of Intervention Studies
1. Introduction
Chronic, low-grade inflammation is a key factor in the pathogenesis of cardiovascular disease [1], and is associated with the risk of developing diabetes [2,3], dementia [4], and depression [5]. Also, low-grade inflammation is related to a higher risk of all-cause mortality in old age [6]. Therefore, identifying modifiable risk factors that could effectively lower chronic inflammation would contribute to the prevention of chronic disease.
According to observational data reports, it has been consistently reported that dietary sugar intake (more specifically, sugar-sweetened beverages (SSB)) may be one stimulus of subclinical inflammation, as measured by the inflammatory marker C-reactive protein (CRP) [7,8,9,10]. Dietary sugar is consumed in significant amounts in Western diets. In a review of the sugar consumption of 18 developed countries, it was found that total sugar intake as a percentage of energy ranged between 13.5–24.6% in adults [11]. In the United States, Nationwide Food Consumption Surveys (NHANES) have suggested that the percentage of sweeteners from high-fructose corn syrup (HFCS) increased from 16% in 1978 to 42% in 1998, and then stabilized [12]. A similar trend pattern was also observed for total fructose intake as a percentage of carbohydrates [13]. The most recent data has shown that with increased public awareness, the consumption of added sugar in the United States has actually decreased between 1999 and 2008, from a mean of 18.1% of total energy to 14.6% [14]. Overall sugar energy intakes are, however, still much higher than the United Kingdom’s Scientific Advisory Committee on Nutrition (SACN) guidelines, which recommend a maximum free sugars intake of 5% daily energy intake [15], and the World Health Organization (WHO), which recommends a maximum of 10% (5% for further health benefits) [16].
It has been postulated that dietary sugar consumption contributes to increased inflammatory processes in humans. Central to the potentially relevant mechanisms is the fact that dietary sugar promotes de novo synthesis of free fatty acids (FFA) in the liver [17,18,19], which according to the lipotoxicity theory, would produce FFA metabolites that may trigger inflammatory processes and reactive oxygen species (ROS) formation [20,21].
The differences in the metabolism of fructose (alone or found in sucrose) versus that of glucose should be considered, in order to distinguish what potential role these monosaccharides may play in increasing inflammatory processes. In contrast to glucose, which can be metabolized by any cell in the body, fructose must be metabolized in the liver. Since there are no negative feedback mechanisms that control for and prevent excess substrate supply of fructose to liver mitochondria, fructose is independently partly converted to acetyl-CoA, which is a building block for fatty acid synthesis [19]. This metabolic pathway of fructose supports the lipotoxicity theory, however, it remains to be established whether dietary fructose/sucrose is more important than dietary glucose for promoting inflammation in human studies.
Therefore, the aim of the current meta-analysis and systematic review was to evaluate the evidence from published human interventional studies regarding the relevance of dietary fructose (alone, or found in sucrose or HFCS) and dietary glucose as a comparator for biomarkers of subclinical inflammation. This evaluation was done quantitatively, through a meta-analysis, and qualitatively, through a brief narrative review. Quality of meta-evidence was also assessed [22]. We selected the acute-phase protein high-sensitivity C-reactive protein (hsCRP), proinflammatory cytokines (interleukin-6 (IL-6), interleukin-18 (IL-18), interleukin-1 receptor antagonist (IL-1RA), tumor necrosis factor-α (TNF-α)), the chemokine monocyte chemoattractant protein 1 (MCP-1), soluble adhesion molecules (soluble E-selection (sE-selectin), soluble intercellular adhesion molecule-1 (sICAM-1)), and the anti-inflammatory adipokine adiponectin as biomarkers of subclinical and vascular inflammation, because they are the most commonly measured inflammation-related biomarkers in clinical and epidemiologic studies, with established associations with cardiometabolic diseases [23,24,25,26,27,28].
Does Sugar Cause Inflammation in the Body?
Inflammation is part of the body’s natural healing process.
During injury or infection, the body releases chemicals to help protect it and fight off any harmful organisms. This can cause redness, warmth and swelling.
Some foods, like sugar, can also cause inflammation in the body, which is normal.
However, eating too many inflammatory foods may cause chronic low-grade inflammation. This can cause serious health problems, such as heart disease, diabetes, cancer, and allergies (
This article covers all you need to know about the role of sugar and inflammation in the body.

Several animal studies have shown that a diet high in added sugar leads to obesity, insulin resistance, increased gut permeability and low-grade inflammation (
Human studies confirm the link between added sugar and higher inflammatory markers.
A study of 29 healthy people found that consuming only 40 grams of added sugar from just one 375-ml can of soda per day led to an increase in inflammatory markers, insulin resistance and LDL cholesterol. These people tended to gain more weight, too (
Another study in overweight and obese people found that consuming one can of regular soda daily for six months led to increased levels of uric acid, a trigger for inflammation and insulin resistance. Subjects who drank diet soda, milk or water had no increase in uric acid levels (
Drinking sugary drinks can spike inflammation levels. Moreover, this effect can last for a considerable amount of time.
Consuming a 50-gram dose of fructose causes a spike in inflammatory markers like C-reactive protein (CRP) just 30 minutes later. Furthermore, CRP remains high for over two hours (
In addition to added sugar, eating too many refined carbohydrates has also been linked to increased inflammation in humans (
In one study, eating just 50 grams of refined carbs in the form of white bread resulted in higher blood sugar levels and an increase in the inflammatory marker Nf-kB (
SUMMARYConsuming too much added sugar and refined carbohydrates is linked with elevated inflammation in the body as well as insulin resistance and weight gain.


From live discussions to personal 1-1 support, having someone to talk to changes everything. Join the free T2D Healthline Community today.
Consuming excess added sugar and refined carbohydrates causes several changes in the body, which help explain why a diet high in sugar can lead to chronic, low-grade inflammation.
- Excess production of AGEs: Advanced glycation end products (AGEs) are harmful compounds that form when protein or fat combine with sugar in the bloodstream. Too many AGEs leads to oxidative stress and inflammation (
12 ). - Increased gut permeability: Bacteria, toxins and undigested food particles can more easily move out of the gut and into the bloodstream, potentially leading to inflammation (
5 ,13 ). - Higher “bad” LDL cholesterol: Excess LDL cholesterol has been associated with higher levels of C-reactive protein (CRP), a marker of inflammation (
6 ,14 ). - Weight gain: A diet rich in added sugar and refined carbohydrates can lead to weight gain. Excess body fat has been linked to inflammation, partly due to insulin resistance (
15 ).
It is important to remember that inflammation is unlikely to be caused by sugar alone. Other factors like stress, medication, smoking and excess fat intake can also lead to inflammation (
SUMMARYExcess consumption of added sugar and refined carbohydrates is linked to increased AGE production, gut permeability, LDL cholesterol, inflammatory markers and weight gain. All of these factors can trigger low-grade chronic inflammation.
CuraLin capsules contain herbs that promote healthy blood sugar levels even if you've struggled in the past.
Observational studies in humans have linked high added sugar and refined carbohydrate intake to many chronic diseases, including heart disease, cancer, diabetes, obesity and more.
Heart Disease
Several studies have found a strong link between consuming sugary drinks and an increased risk of heart disease (
A large study involving more than 75,000 women found that those who consumed a diet high in refined carbohydrates and sugar had up to a 98% greater risk of heart disease, compared to women with the lowest intake of refined carbs (
This is likely due to the impact of sugar consumption on heart disease risk factors, such as increased LDL cholesterol, increased blood pressure, obesity, insulin resistance and increased inflammatory markers (
Cancer
Several studies show people with high sugar intakes may be at a greater risk of developing cancer (
One study found that when mice were fed high-sugar diets, they developed breast cancer, which then spread to other parts of the body (
One study looking at the diets of over 35,000 women found that those who consumed the most sugary foods and drinks had double the risk of developing colon cancer, compared to those who consumed a diet with the least added sugar (
While more research is needed, it is thought that the increased risk of cancer may be due to the inflammatory effect of sugar. In the long-term, inflammation caused by sugar may damage DNA and body cells (
Some experts believe that chronically high insulin levels, which can result from consuming too much sugar, may also play a role in cancer development (
Diabetes
Studies link the increased consumption of added sugar to type 2 diabetes (
A large analysis including over 38,000 people found that just one serving of sugary drinks daily was associated with an 18% greater risk of developing type 2 diabetes (
Another study found that increasing corn syrup intake was strongly associated with diabetes. In contrast, fiber intake helped protect against the development of diabetes (
Obesity
Obesity is often referred to as a low-grade inflammatory disease. Eating too much added sugar is linked to weight gain and obesity (
Experts suggest that modern diets, which are often high in refined carbs and added sugar, can lead to an imbalance in gut bacteria. This may partly explain the development of obesity (
A review of 88 observational studies found that a higher intake of sugary soda was associated with greater calorie intake, higher body weight and lower intake of other important nutrients (
One study in mice found that a diet high in sugar counteracted the anti-inflammatory effects of fish oil and promoted obesity (
Other Diseases
A high intake of added sugar and refined carbs has been linked to the development of other diseases, such as liver disease, inflammatory bowel disease, mental decline, arthritis and others (
In particular, excess fructose consumption has been linked to non-alcoholic fatty liver disease. How this happens isn’t fully understood, but is thought to be due to a mix of increased gut permeability, bacterial overgrowth in the gut and ongoing low-grade inflammation (
However, evidence connecting sugar to health problems is mostly based on observational studies. Therefore, they cannot prove that sugar alone was the cause of these health problems (
SUMMARYObservational studies have linked excess added sugar consumption to the development of several chronic diseases, such as diabetes, heart disease, obesity and cancer.
It’s important to note that there is a difference between added sugar and natural sugar.
Added sugar is removed from its original source and added to foods and drinks to serve as a sweetener or increase shelf life.
Added sugar is found mostly in processed foods and drinks, though table sugar is also considered an added sugar. Other common forms include high-fructose corn syrup (HFCS), sucrose, fructose, glucose and corn sugar.
Among US adults, around 13% of total calories come from added sugar. This is high, considering that government guidelines advise that no more than 5% to 15% of calories should come from both solid fats and added sugar (
Excess amounts of added sugar and refined carbs have been linked to inflammation (
However, natural sugar has not been linked to inflammation. In fact, many foods containing natural sugars, such as fruits and vegetables, may be anti-inflammatory (
Natural sugars include those naturally occurring in foods. Examples include fructose in fruit and lactose in milk and dairy products.
Consuming natural sugars should not be any cause for concern. That’s because they act very differently than added sugar when consumed and digested in the body.
Natural sugar is usually consumed within whole foods. Thus, it is accompanied by other nutrients, such as protein and fiber, which cause natural sugars to be absorbed slowly. The steady absorption of natural sugar prevents blood sugar spikes.
A diet high in whole foods like fruit, vegetables and whole grains can have other health benefits, too. There is no need to limit or avoid whole foods (
SUMMARYAdded sugar, which is removed from its original source and added to foods and drinks, is associated with inflammation. Natural sugar, which is found in whole foods, is not.
The good news is that certain lifestyle changes, such as reducing your intake of sugary and processed foods, can lead to lower inflammation levels in the body (
For example, consuming fructose has a dose-dependent impact on inflammation. This means the more you eat, the greater the inflammation in the body (
In addition, a sedentary lifestyle, smoking and high stress levels have also been associated with chronic low-grade inflammation (
However, regular physical activity has been shown to reduce belly fat and inflammatory markers in humans (
Therefore, it seems possible to reduce inflammation levels by making dietary changes.
One study found that replacing processed foods with whole, unprocessed foods improved insulin resistance, improved cholesterol levels and reduced blood pressure, all of which are related to inflammation (
Another study found that reducing fructose consumption improved inflammatory blood markers by almost 30% (
Below are some simple tips to help reduce inflammation:
- Limit processed foods and drinks: By reducing or eliminating these products, you’ll naturally exclude key sources of added sugar like soda, cakes, cookies and candy, as well as white bread, pasta and rice.
- Read food labels: If you are unsure about certain products, get into the habit of reading food labels. Look out for ingredients like sucrose, glucose, high-fructose corn syrup, maltose and dextrose.
- Choose whole-grain carbs: These include oats, whole-grain pasta, brown rice, quinoa and barley. They have lots of fiber and antioxidants, which can help control blood sugar and protect against inflammation.
- Eat more fruits and vegetables: Fruits and vegetables contain antioxidants, vitamins and minerals, which can protect against and reduce inflammation in the body.
- Eat lots of antioxidant-rich foods: Fill your plate with foods rich in antioxidants, which naturally help counteract inflammation. These include nuts, seeds, avocados, oily fish and olive oil.
- Keep active: Regular physical activity, including both aerobic and resistance exercise, can help protect against weight gain and inflammation.
- Manage stress levels: Learning to manage stress levels through relaxation techniques and even exercise can help reduce inflammation.
SUMMARYReplacing foods and drinks high in added sugar and refined carbohydrates may help lower inflammatory markers. Including whole foods in your diet can also help fight inflammation.
The evidence suggests that eating too much added sugar and too many refined carbohydrates causes inflammation in your body.
Over time, the inflammation caused by poor dietary habits may lead to several health problems, such as heart disease, diabetes, liver disease and cancer.
However, inflammation can also be caused by many other factors, including stress, medication, smoking and excess fat intake (
There are several things you can do to help fight inflammation, including exercising regularly and effectively managing your stress levels.
Furthermore, cut down on processed foods and drinks, choose whole foods, and limit your intake of added sugar and refined carbohydrates.
http://europepmc.org/article/MED/29243862
Abstract
https://www.tandfonline.com/doi/abs/10.1080/01480545.2020.1825472?journalCode=idct20
Toxicological impact of sodium benzoate on inflammatory cytokines, oxidative stress and biochemical markers in male Wistar rats


https://www.spandidos-publications.com/mmr/13/4/3147
Carbonated soft drinks induce oxidative stress and alter the expression of certain genes in the brains of Wistar rats
- Authors:
- Published online on: February 18, 2016 https://doi.org/10.3892/mmr.2016.4903
- Pages: 3147-3154
Abstract
Introduction
Consumption of carbonated soft drinks is high in Saudi Arabia, particularly in middle-aged individuals aged between 35–50 years old. The effects of these products on health are unclear, although epidemiological studies have suggested their association with obesity, kidney disease, liver disease and osteoporosis (1,2). They predominantly consist of water but also commonly contain phosphoric acid, caffeine, sugar and chemicals in the form of colorings, flavors, preservatives and sweeteners. The rate of consumption of these drinks is particularly high in affluent countries (1).
The majority of individuals view carbonated soft drink consumption as fairly innocuous (1). However, there are a number of serious health issues associated with regular consumption of carbonated soft drinks, for example, previous peer-reviewed studies have reported 25 separate harmful effects, including osteoporosis, and kidney and liver disease (2,3). Carbonated soft drinks contain several compounds including caffeine; which is the most widely consumed behaviorally active substance worldwide. Almost all caffeine comes from dietary sources (4). Acute and chronic caffeine intake appear to have only minor negative consequences on health (5). For this reason and because few caffeine users report loss of control over their caffeine intake, governmental regulatory agencies impose no restrictions on its use. In the majority of carbonated beverages, caffeine is deliberately added to make it addictive. However, caffeine in carbonated drinks is more readily absorbed than that from other non-carbonated beverages. The majority of carbonated soft drinks also contain phosphoric acid, caffeine, sugar or aspartame or saccharin, caramel coloring, carbon dioxide, and aluminum. Each of which have been demonstrated to have negative effects on human health (5).
Caffeine is known to be an addictive drug that has the ability to stimulate mental alertness, overcome fatigue and enhance endurance. Caffeine acts by blocking adenosine (neurotransmitter) receptor sites in the central nervous system, and adenosine generally exhibits a depressant action in the brain, heart and kidneys. The resultant stimulation is accompanied by constriction of the cerebral arteries, elevated heartbeat, high blood pressure and excessive excretion of urine. Cases of caffeine-associated fatalities and seizures have previously been identified (4,5) due to a combination of excess caffeine intake and cardiovascular disorders. Moreover, several studies have reported a weaker compensatory response after consumption of caloric liquids (6,7). Previous studies have examined the effect of energy intake on brain histology and activity (6–9). It has been reported that soda exhibited an adverse effect on the cerebellum, whereas non-diet soda exhibited harmful effects (10).
In the Middle East, particularly in Saudi Arabia, it is common for individuals to consume carbonated soft drinks 3 times per day with each meal. Therefore, the current study was conducted to examine the effect of chronic consumption of three common drinks in Saudi Arabia (Cola, Pepsi and 7-UP) on oxidative stress, antioxidant levels, aggression markers, and histopathology of the brain to outline their potential effects on the brains of Wistar rats. In addition, the effect of soft beverages on the expression and activity of certain genes associated with anxiety, violence and/or aggression, such as monoamine oxidase (MAO) and dopamine D2 receptors (DD2R) were examined.
Materials and methods
Chemicals and kits
Ethidium bromide, agarose, Mayer's hematoxylin and eosin (H&E) and Tris-Borate-EDTA (TBE) were purchased from Sigma-Aldrich (St. Louis, MO, USA). The Wistar albino rats were purchased from the King Fahd Center for Scientific Research, King Abdel-Aziz University (Jeddah, Saudi Arabia). Serologic kits for catalase, malondialdehyde (MDA), glutathione reductase (GR) and glutathione peroxidase (GPx) were purchased from Bio-diagnostic Co., (Giza, Egypt). Cola (Atlanta, GA, Pepsi (PepsiCo, Purchase, NY, USA) and 7-UP (Dr Pepper Snapple Group, Inc., Plano, TX, USA) were used. DNA 100 bp ladder was purchased from MBI, Fermentas, Thermo Fisher Scientific. Inc. (Waltham, MA, USA). Qiazol for RNA extraction and oligo dT primers were purchased from Qiagen, Inc., (Valencia, CA, USA).
Animals, experimental design and sampling
All animal procedures were approved by the Ethical Committee Office of Taif University (Taif, Saudi Arabia). Forty male Wistar rats (age, 3 months; weight, 200–280 g) were used for this study. For acclimatization, animals were handled daily and kept under observation for 1 week prior to the onset of the experiment. The animals were kept under a 12-h light-dark cycle and had ad libitum access to food and water. Animals were divided into the following 4 groups: Control group (CNT) without any treatment; Cola group; Pepsi group and 7-UP group. Groups 2–4 received free access to food and only carbonated soft drinks for 3 consecutive months. At the end of the 3 months, all rats were anesthetized using diethyl ether inhalation and sacrificed via decapitation. Blood was collected in vacuteiner tubes from retro-orbital venous plexuses following anesthetization. Brain tissues from the right hemisphere were harvested for gene expression and left hemisphere tissues were used for histopathological analyses. Serum was extracted after blood centrifugation for 10 min at 4,000 × g. For gene expression analysis, brain tissues were kept in QIAzol reagent at −80°C for RNA extraction and in 10% neutral buffered formalin (NBF) at room temperature for 24 h for histopathological and immunohistochemical analysis.
Serum chemistry assays
Catalase, GR, GP and MDA were measured using commercial spectrophotometric analysis kits (Bio-Diagnostic Company, Giza, Egypt). MAO and acetylcholine esterase (AChE) levels were measured using commercial enzyme-linked immunosorbent assay kits obtained from MyBioSource, Co. (San Diego, CA, USA). All procedures were conducted according to the manufacturer's protocol. mRNA expression levels of glutathione-S-transferase (GST) and 5-hydroxy tryptamine transporter (5-HTT) were assessed using reverse transcription-polymerase chain reaction (RT-PCR) analysis.
Gene expression analysis
Total RNA was extracted from the brain tissue samples as previously described (11). RNA concentration and purity were determined spectrophoto-metrically after measuring the optical density at 260 and 280 nm using a SmartSpec Plus spectrophotometer (Bio-Rad, Hercules, CA, USA). The RNA integrity was confirmed after running in 1.5% denatured agarose gel stained with ethidium bromide. A mixture of 3 µg total RNA and 0.5 ng oligo dT primer (Qiagen Inc., Valencia, CA, USA) were used for cDNA synthesis in a total volume of 11 µl sterilized diethylpyrocarbonate (DEPC) water and was incubated in the Bio-Rad T100 Thermal cycler (Bio-Rad) at 65°C for 10 min for denaturation. Then, 2 µl of 10X RT-buffer, 2 µl of 10 mM dNTPs and 100 units Moloney Murine Leukemia Virus Reverse Transcriptase (SibEnzyme. Ak, Novosibirsk, Russia) were added and made up to a total volume of 20 µl with DEPC water. The mixture was then re-incubated in the thermal cycler at 37°C for 1 h, then at 90°C for 10 min to inactivate the enzyme. For semi-quantitative RT-PCR analysis, specific primers for examined genes (Table I) were designed using the Oligo-4 computer program (version 7; Molecular Biology Insights, Colorado Springs, CO, USA) and synthesized by Macrogen (Macrogen Inc., Gasadong, Korea). PCR was conducted in a final volume of 25 µl consisting of 1 µl cDNA, 1 µl of 10 pM of each primer (forward and reverse), and 12.5 µl PCR master mix (Promega Corporation, Madison, WI, USA), the volume was made up to 25/µl using sterilized deionized water. PCR was conducted using the Bio-Rad T100 Thermal Cycler with the following cycle sequence: 94°C for 5 min for one cycle, followed by 27–31 cycles (Table I) each of which consisted of denaturation at 94°C for 1 min, annealing at the specific temperature corresponding to each primer (Table I) and extension at 72°C for 1 min with an additional final extension at 72°C for 7 min. As a reference, expression of glyceraldehyde-3-phosphate dehydrogenase (GAPDH) mRNA was examined (Table I). PCR products were visualized under UV light after electrophoresis on 1.5% agarose (Bio Basic Int., Markham, ON, Canada) gel stained with ethidium bromide in TBE buffer. PCR products were confirmed using a 100 bp DNA ladder and were subsequently photographed using an InGenius 3.0 gel documentation system (Syngene, Frederick, MD, USA). The intensities of the bands were quantified densitometrically using Image J software version 1.47 (http://imagej.en.softonic.com/).

Brain histopathology
Brain was removed following diethyl ether inhalation and sacrifice of the rats and fixed overnight in a 10% NBF solution. Fixed brain tissues were processed routinely, washed and preserved in 70% ethanol, dehydrated in ascending grades of ethanol solution, cleared in xylene, embedded in paraffin wax, pressed and cut into 5-µm sections. Subsequently, the sections were placed on top of glass slides. The slides were stained with Mayer's H&E (12). Tissue slides were visualized using a Wolfe S9–0982 microscope (Carolina Biological Supply Co., Burlington, NC, USA) and photos were captured using a Canon Power-Shot SX500 IS digital camera (Canon, Tokyo, Japan).
Statistical analysis
Results are presented as the mean ± standard error of mean. Data were analyzed using analysis of variance and Fisher post hoc descriptive tests using SPSS software version 11.5 (SPSS, Inc., Chicago, IL, USA). Regression analysis was performed using the same software. P<0.05 was considered to indicate a statistically significant difference.
Results
Effect of carbonated soft drink consumption for 3 months on serum levels of MDA, GR, GPx and catalase in Wistar rats
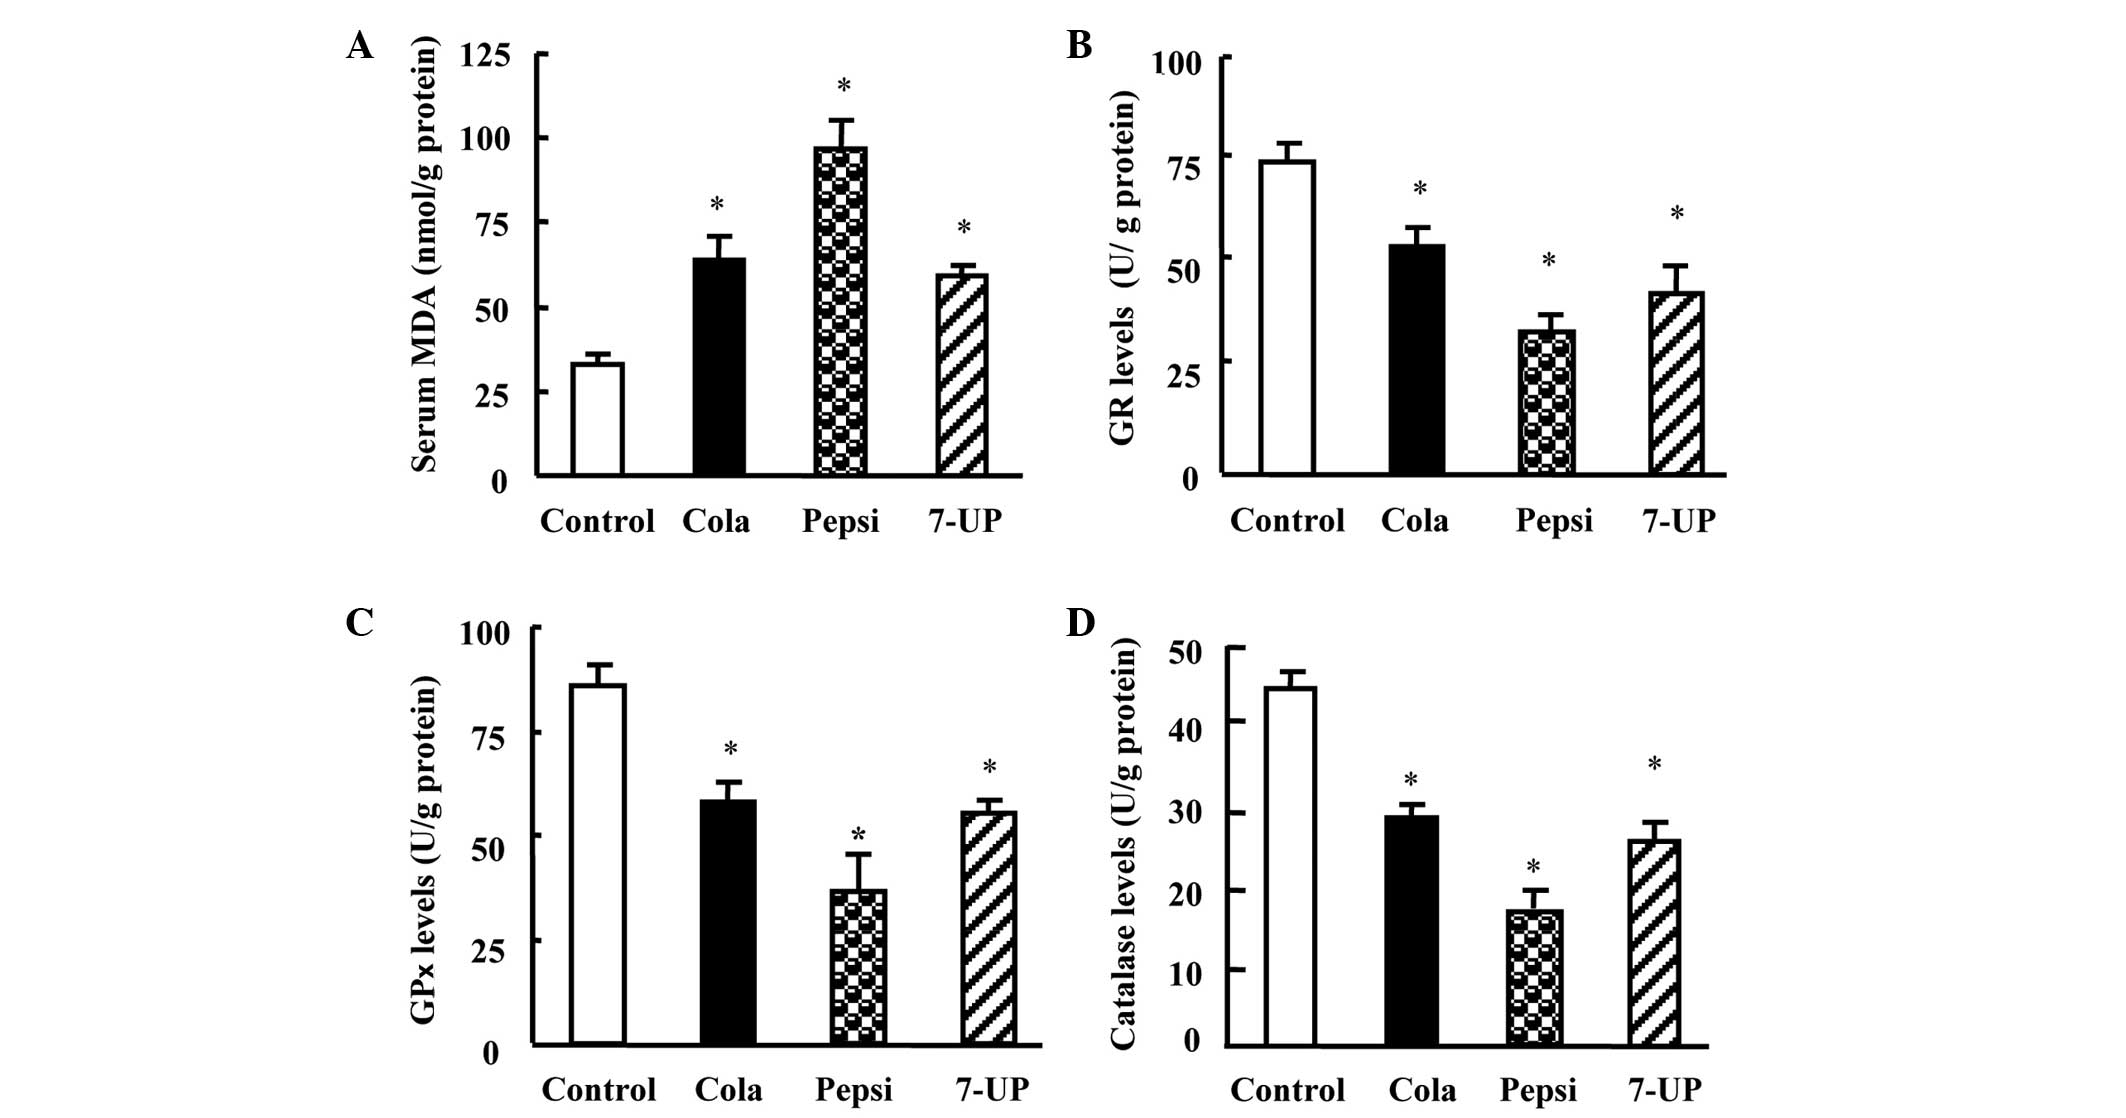
Consumption of Cola, Pepsi and 7-UP for 3 months showed a significant increase in MDA levels (Fig. 1A; P<0.05) with the greatest increase in the rats from the Pepsi group. In parallel, the levels of antioxidants GR, GPx and catalase in the rats were decreased significantly in all groups administered carbonated soft drinks compared with the control. Notably, the greatest changes were observed in the rats from the Pepsi group (Fig. 1B–D).
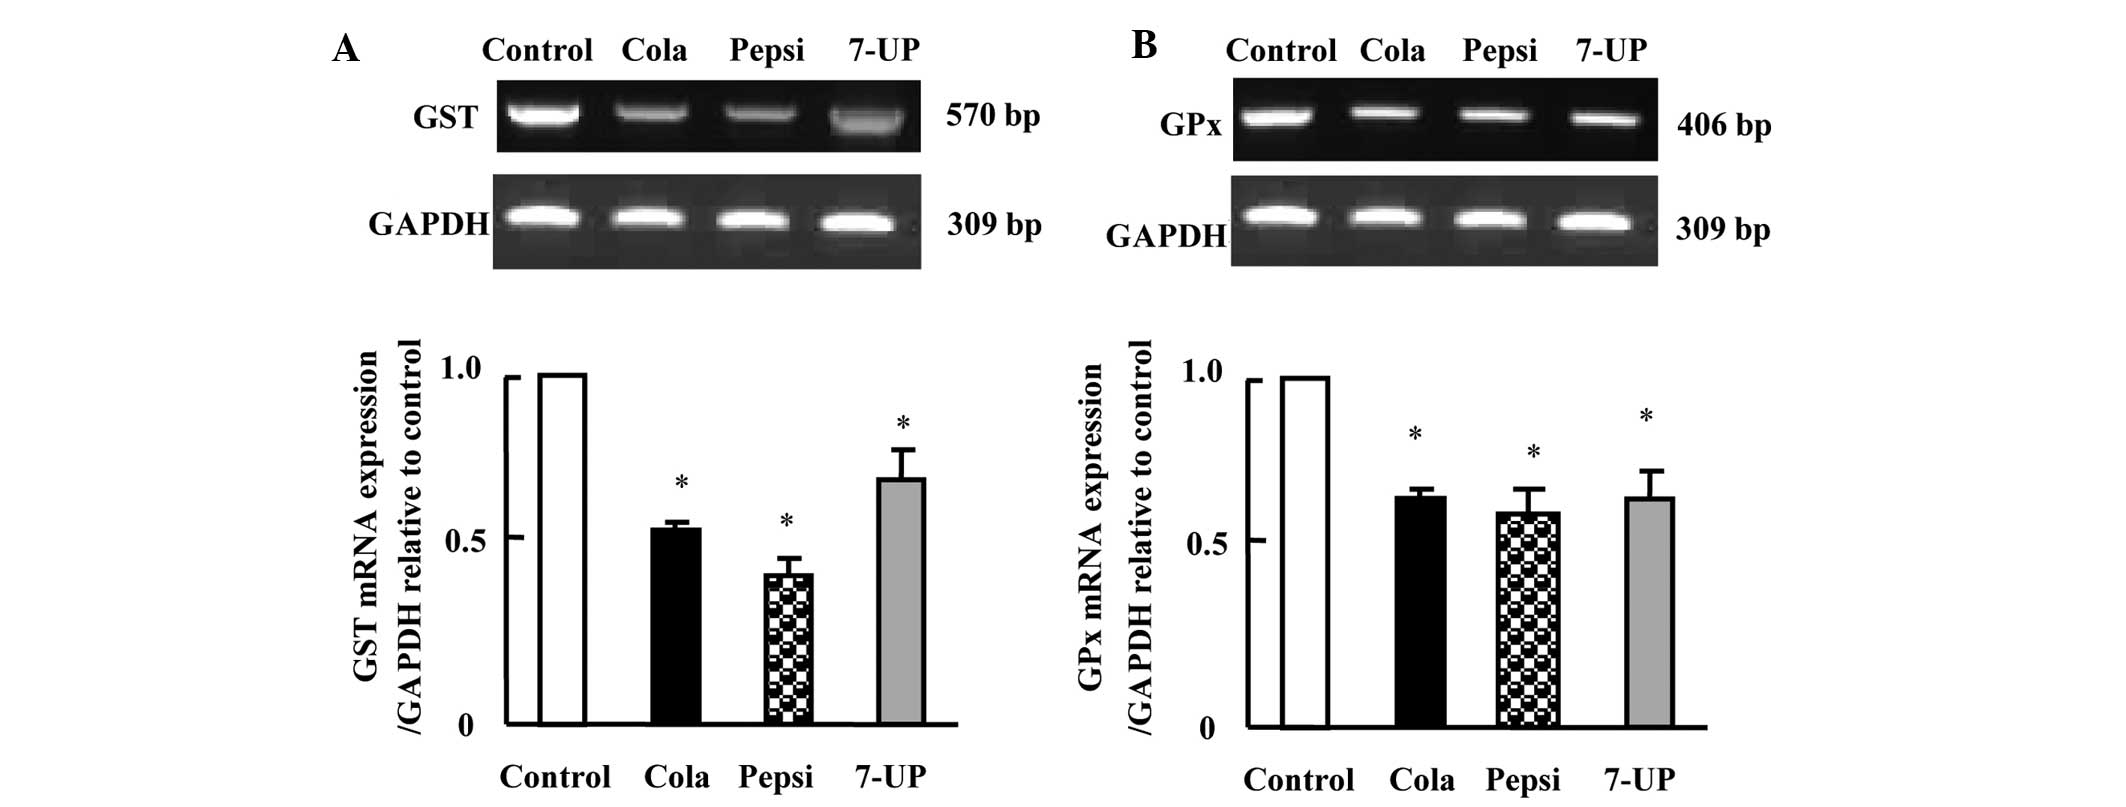
Effect of carbonated soft drink consumption for 3 months on mRNA expression of GST and GPx in the brain tissues of Wistar rats
As shown in Fig. 2, carbonated soft drink consumption for 3 months downregulated the mRNA expression of GST and GPx. Expression levels were significantly decreased by 50 and 40% in the Cola and Pepsi groups for GST and GPx, respectively (P<0.05). Although still significantly reduced when compared with the control (P<0.05), rats in the 7-UP group demonstrated increased levels of GST and GPx, as compared with the Cola and Pepsi groups.
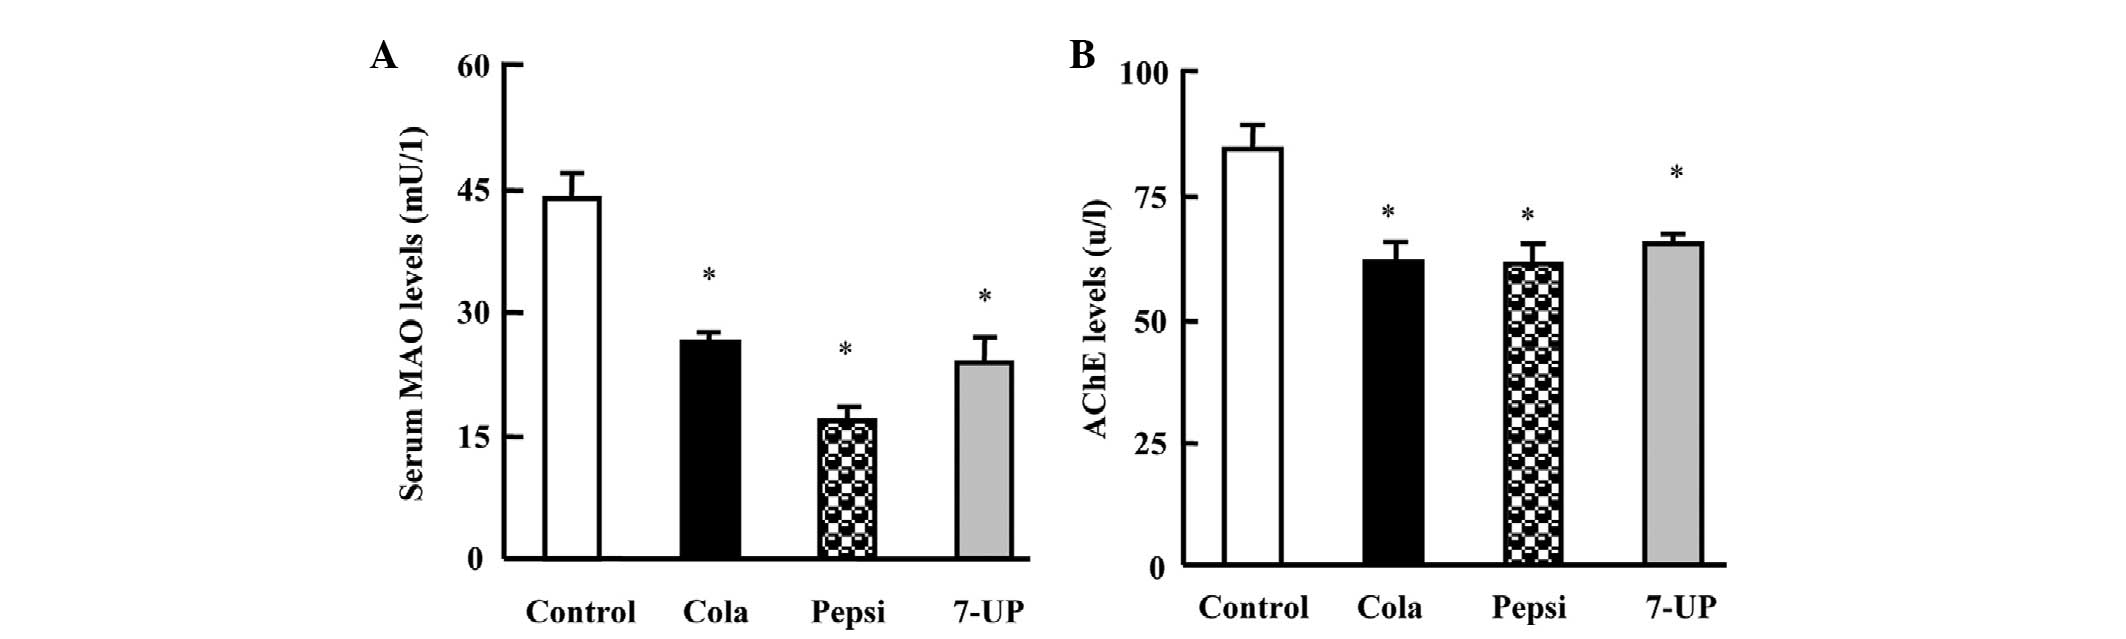
Effect of carbonated soft drink consumption for 3 months on serum levels of MAO-A and AChE in Wistar rats
Next, the changes in MAO-A and AChE levels (Fig. 3) were examined. Cola, Pepsi and 7-UP consumption for 3 months resulted in a significant decrease in MAO and AChE levels (P<0.05). Rats in the Pepsi group exhibited the greatest decreases in MAO-A and AChE levels, as compared with the other groups.
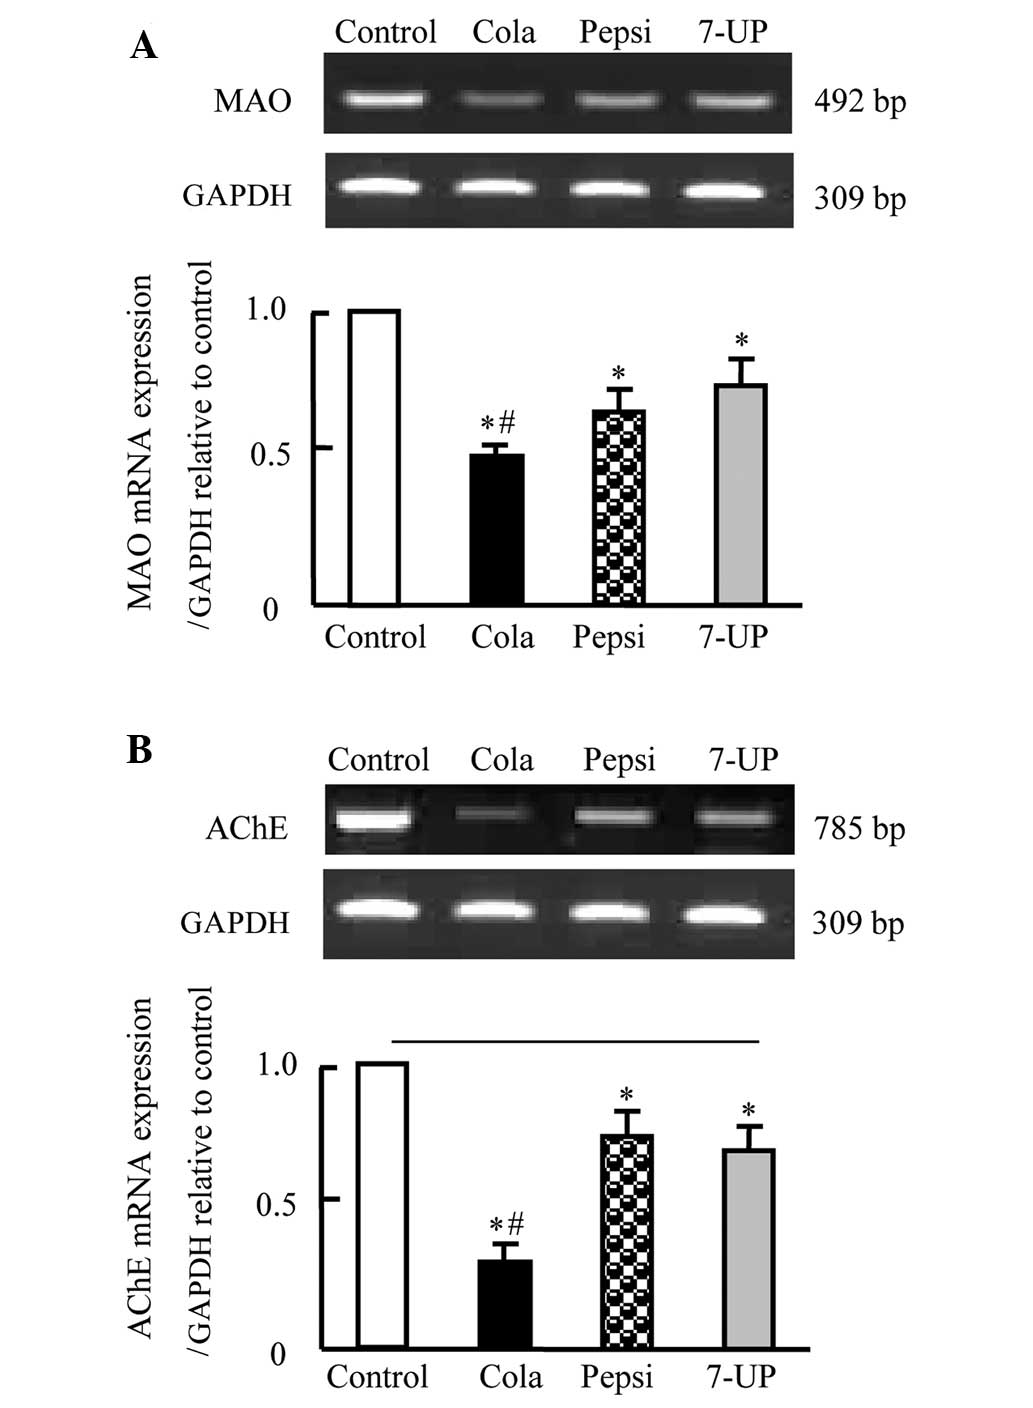
Effect of carbonated soft drink consumption for 3 months on mRNA expression of MAO-A and AChE in brain tissues of Wistar rats
Fig. 4 shows that, consistent with serum changes of MAO-A and AChE, the mRNA expression of MAO-A and AChE was significantly downregulated in the brain tissues of rats administered carbonated soft drinks (P<0.05). Rats in the Cola group exhibited the greatest decrease in MAO-A and AChE expression, followed by Pepsi and 7-UP, respectively. The decrease was not identified to be significantly different between the Pepsi and 7-UP groups (Fig. 4).
Effect of carbonated soft drink consumption for 3 months on mRNA expression of DD2R and 5-HTT in brain tissues of Wistar rats
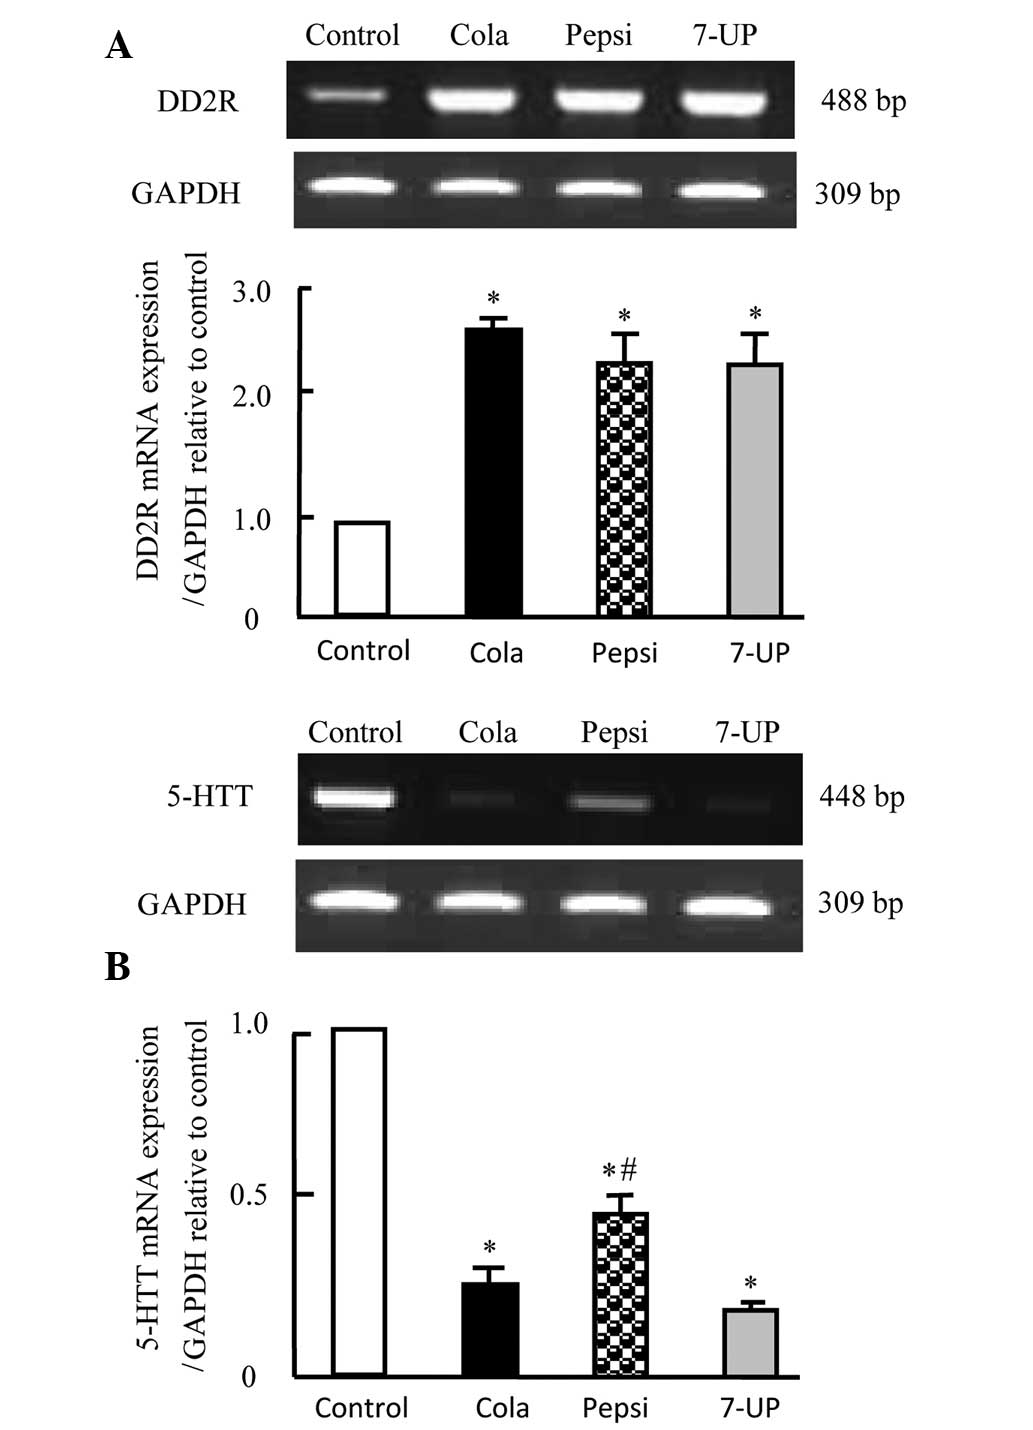
The effects of carbonated soft drink consumption on the expression of certain genes that have been shown to be associated with aggression were investigated. As shown in Fig. 5A, expression of DD2R was significantly upregulated in rats in the Cola, Pepsi and 7-UP groups (P<0.05). By contrast, the rats in these groups exhibited significant downregulation of 5-HTT mRNA expression (Fig. 5B; P<0.05). Furthermore, rats in the Cola and 7-UP groups exhibited significantly decreased expression of 5-HTT, as compared with rats in the Pepsi group (P<0.05).
Effect of carbonated soft drink consumption for 3 months on brain histopathology
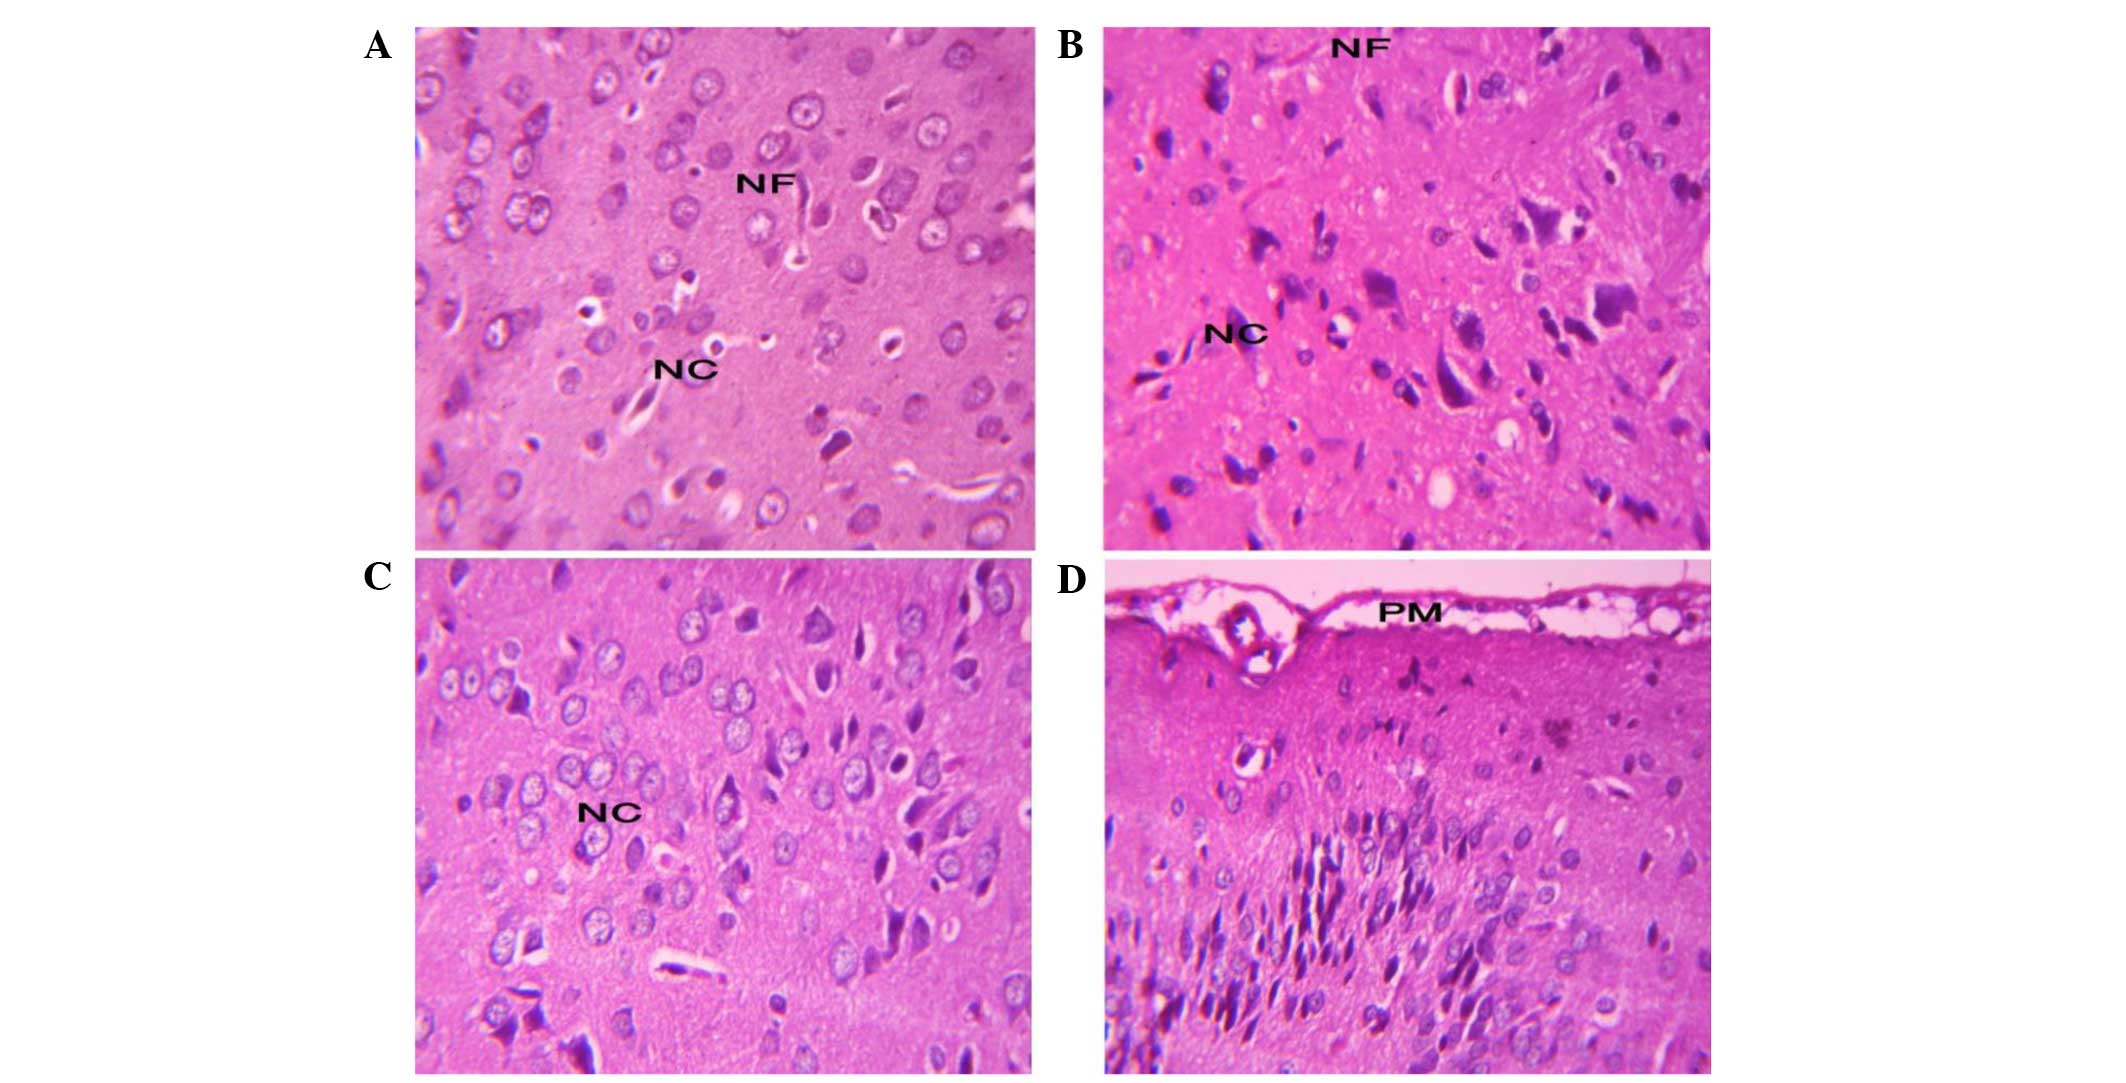
Although changes induced by carbonated soft drinks were observed at the biochemical and molecular levels, brain histopathology analysis showed normal brain architecture in all groups (Fig. 6). The gray matter of the rats appeared normal with its well-organized regularly arranged six layers and different size and shape nerve cells. The normal pattern of the white matter is formed of homogeneously stained nerve fibers running down the cortex was also identified.
Discussion
The results of current study confirmed that chronic consumption of carbonated soft drinks induced oxidative stress and changes in antioxidant expression in the brains of Wistar rats. Moreover, soft drink consumption decreased the serum levels and mRNA expression of MAO and AChE in the brain. Notably, it was also demonstrated that the levels of DD2R were downregulated and the levels of 5-HTT expression were upregulated in the brain, while brain histopathology remained unaffected.
Oxidative stress has been associated with the etiopatho-genesis of several chronic diseases and exhibits a key role in the aging process (13). One of the consequences of uncontrolled oxidative stress (imbalance between the prooxidant and antioxidant levels in favor of prooxidants) is injury to cells, tissues and organs by oxidative damage. It has long been recognized that high levels of free radicals or reactive oxygen species (ROS) can directly damage lipids. The primary sources of endogenous ROS production are the mitochondria, plasma membrane, endoplasmic reticulum and peroxisomes (14). ROS are produced through a variety of mechanisms, including enzymatic reactions and/or auto-oxidation of several compounds, such as catecholamines and hydroquinone. In this study, chronic carbonated soft drink consumption induced oxidative stress in the brain as indicated by the increase in MDA levels in addition to the decrease in the expression of antioxidants, GR, GPx and catalase.
Carbonated soft drinks contain caffeine and phosphoric acid. Caffeine causes the release of adrenaline and an accompanying increase in blood sugar levels to produce the required energy. Caffeine reaches its peak level in the blood within 1 h of consumption and remains in the body for 4–6 h (4,5). Caffeine in soft drinks causes an increases in the release of acid into the stomach, which may lead to an upset stomach or heartburn. Moreover, caffeine has been reported that chronic exposure to the various components of energy and soft drinks may result in significant alterations in the cardiovascular system and brain activity (15,16). The results of the present study demonstrated an alteration in MAO-A and AChE at the serum and mRNA levels. MAO has 2 isozymes, A and B. MAO-A in humans is encoded by the MAOA gene (17,18). It preferentially deaminates norepinephrine, epinephrine, serotonin and dopamine (all are equally deaminated by MAO-A and MAO-B). Inhibition of both MAO-A and MAO-B using MAO inhibitor is used in the treatment of clinical depression, erectile dysfunction and anxiety. MAO-A has been shown to be increased in patients with depression (19) and an association has been demonstrated between low-activity forms of the MAO-A gene and autism (20). A dysfunctional MAO-A gene has also been correlated with increased aggression levels in mice (21,22), as well as with heightened levels of aggression in humans (23). The results of the present study demonstrated that the consumption of carbonated soft drinks decreased MAO-A gene expression and were associated with oversensitivity, as MAO-A decrease is correlated with aggression and violence, this may suggest consumption of carbonated soft drinks is correlated with increased aggression and violence but this requires further investigation.
It is well-established that cholinergic neurons are involved in several neuropsychic functions, such as learning, memory and sleep. Acetylcholine exhibits a key role in modulating these functions (24). A central cholinergic deficit is strongly associated with certain neurodegenerative diseases, such as Alzheimer's disease and Parkinson's disease (25). Evidence of autism due to dysfunction of the cholinergic system has recently been reported (26). AChE is a specific cholinergic marker protein for the functional state of cholinergic neurons. It is key in the maintenance of acetylcholine levels at the cholinergic neurons (27) as it is responsible for degradation of acetylcholine to acetate and choline in the synaptic cleft. Notably, AChE was observed to be decreased in the serum and AChE mRNA expression was observed to be decreased in the brain. It has previously been suggested that acetylcholine disruption may be a primary cause of depression and/or aggression (28).
Dopamine is a neurotransmitter of the catecholamine and phenethylamine families that exhibits a number of roles in the human brain and body. There are 5 isoforms of the dopamine receptor, dopamine D1–5 receptors. DD2R is the most common receptor in the mammalian brain. DD2R antagonists have been used for decades to treat aggressive behavior in psychotic patients (29). In addition, in a preclinical study the role of dopamine D1, D2 and D3 receptors in the modulation of aggression has been documented (30). Several studies have indicated that the mesocorticolimbic dopamine system is involved in the preparation, execution and consequences of aggressive acts (31–33). Pharmacologically induced dopamine increases are associated with increased aggressive behavior under certain conditions (32,33). The results of the present study demonstrated that DD2R levels increased following chronic carbonated soft drink consumption. This was probably due to the increase in dopamine levels resulting from the downregulation of MAO-A expression.
Two major enzymes are responsible for catecholamine catabolism in the brain: Catechol-O-methyltransferase (COMT) and monoamine oxidase A (MAO-A). If aggressive behavior is enhanced by catecholaminergic activity, then decreased activity of COMT and MAO-A should indirectly increase levels of aggression (31,34).
5-HTT expression was shown to be downregulated following chronic carbonated soft drink consumption. A number of studies have shown that elevated serotonin levels lead to decreased aggression in a number of species (35), including humans (36). Blocking serotonin transporter molecules is effective in reducing and preventing aggressive behavior in humans and other animals, presumably due to increased brain 5-HT levels (35). Clinically, blocking 5-HTT with the administration of selective serotonin reuptake inhibitors (SSRIs), reduces aggressive outbursts and violent behavior in psychiatric patients (37–39). In addition, in animal models, acute and chronic treatment with SSRIs can dose-dependently reduce aggressive behavior (40). Acute administration of several SSRIs reduced aggression in different contexts and species, including rodents and non-human primates (40,41). 5-HTT is a type of monoamine transporter protein that transports serotonin from the synaptic cleft to the pre-synaptic neuron. This transport of serotonin by the 5-HTT protein terminates the action of serotonin and recycles it in a sodium-dependent manner. This protein is the target of numerous antidepressant agents, including those of the SSRI class (42). A repeat length polymorphism in the promoter of this gene has been shown to affect the rate of serotonin uptake and may exhibit a role in sudden infant death syndrome, aggressive behavior in Alzheimer disease patients, post-traumatic stress disorder and depression-susceptibility in individuals experiencing emotional trauma (43). It has also been suggested that alterations in 5-HTT expression levels following the consumption of carbonated soft drinks may be a predisposing factor for depression.
Histological examination of the brain revealed that the brain exhibited normal histology and cell distribution following chronic carbonated soft drink consumption. This finding was also reported in another study (10) for regular soft drinks; however, previously diet soft drinks were shown to exhibit adverse effects on the cerebellum of albino rats (10).
In conclusion, chronic term carbonated soft drink consumption induced oxidative stress and alterations in antioxidants and the expression levels of certain genes associated with brain function. Therefore, the results of the present study suggested that the consumption of carbonated soft drinks may induce adverse effects, thus these drinks must be consumed with caution.
https://www.hindawi.com/journals/omcl/2019/9042526/
Research Article | Open Access
Worsening of Oxidative Stress, DNA Damage, and Atherosclerotic Lesions in Aged LDLr-/- Mice after Consumption of Guarana Soft Drinks
Layla Aparecida Chisté,1 Beatriz Peters Pereira,1 Marcella Leite Porto,2 Jairo Pinto de Oliveira,3 Arícia Leone Evangelista Monteiro de Assis,3 Breno Valentim Nogueira,3 Silvana Santos Meyrelles
 ,4 Tadeu Uggere de Andrade,1 Manuel Campos-Toimil,5 Elisardo Corral Vasquez,1,4 Bianca Prandi Campagnaro,1 and Thiago Melo Costa Pereira1,2,5
Abstract
Background. Excessive consumption of soft drinks (SD) has become a health problem worldwide due to its association with related cardiovascular diseases. We investigated the possible impacts associated with the consumption of Brazilian guarana (normal and zero) SD in dyslipidemic mice, thus mitigating potential clinical confounders such as poor-quality diet, lifestyle, body composition, and/or comorbidities. Methods. Sixteen-month-old LDLr-/- mice were divided into the following groups: (1) control; (2) GSD: normal guarana SD; and (3) Z-GSD: zero guarana SD. All were fed ad libitum, and blood pressure was measured noninvasively. After 8 weeks, aorta, blood, liver, and stomach samples were collected for histological and biochemical analyses. Results. Guarana soft drinks increased atherosclerosis (~60%) and were associated with hypercholesterolemia, hypertension, oxidative stress, DNA fragmentation, and apoptosis (~2-fold) of blood cells, besides presenting an increase in liver and gastric damage even in normoglycemia. Interestingly, Z-GSD did not cause the aforementioned changes, except in hemodynamic and renal parameters. Conclusions. Chronic administration of GSD is prooxidative, compromising the cardiovascular, gastric, and hepatic systems; the effects are due at least in part to free sugar consumption but not to guarana extract per se.
1. Introduction
Excessive consumption of sugar-sweetened soft drinks (SD) has become an alarming public health problem worldwide due to its association with dyslipidemia, weight gain, diabetes type 2, and other related cardiovascular diseases [1, 2]. As an alternative, SD containing artificial sweeteners, considered as “healthier,” have emerged to try to maintain the profitability of companies [3, 4]. However, the intrinsic toxicity of these carbonated beverages is still controversial, reinforced by scarce experimental data and potential clinical confounders, such as poor-quality diet, lifestyle, body composition, and/or comorbidities [5–7]. Thus, experimental studies are needed to clarify the impact of long-term consumption of SD and its consequences.
Interestingly, only in the last decade have some experimental studies described pathophysiological metabolic alterations after chronic exposure to sugar and artificially sweetened SD, especially colas [2, 8–13]. However, these data may not be extrapolated to all SD, as specific substances are present only in cola beverages (e.g., natural flavorings, colorants, fluid extract of coca, and phosphoric acid), and it is necessary to investigate other SD consumed in the world, such as guarana SD. Guarana SD are made from extracts that have been obtained from the dried seeds of guarana (Paullinia cupana H.B.K., Sapindaceae) in the Brazilian Amazonian region since 1921 [14, 15]. In the global market, guarana SD, available in both sugar and artificially sweetened forms, are among the fifteen highest selling SD in the world and the second most consumed in Brazil [16]. Until now, the possible consequences of long-term guarana consumption on cardiovascular-metabolic diseases have not yet been evaluated. Thus, this study reports for the first time the effects of long-term consumption of regular guarana SD (sucrose-sweetened, GSD) and zero guarana SD (aspartame-acesulfame K-sweetened, Z-GSD) in the LDLr-/- mouse model.
As rats are commonly resistant to the effects of overabundant nutrients, genetically modified mice have been widely used in studies of cardiovascular-metabolic diseases, thus expanding translational applications [17–21]. Among these, LDLr-/- mice show age-dependent susceptibility to concomitant metabolic complications such as dyslipidemia, obesity, and insulin resistance, mimicking humans with metabolic syndrome [21–23].
In this context, the objective of this study was to investigate possible biochemical and/or morphofunctional impacts associated with the consumption of GSD and Z-GSD in aged dyslipidemic mice, mitigating the influence of potential confounders associated with SD consumption in human subjects. These new results may help to fill the data gaps to better inform scientists, patients, clinicians, and governments.
2. Methods
2.1. Animals and Experimental Design
Under a normal chow diet provided ad libitum, female LDLr-/- mice, aged ~16 months old, were randomly separated into 3 groups with free access to one of the following drinks: water (control), regular guarana SD (GSD) (sucrose-sweetened carbonated drink, Guaraná Antarctica®, Brazil), or zero guarana SD (Z-GSD) (low-calorie aspartame–acesulfame K-sweetened carbonated drink, Guaraná Antarctica Zero®, Brazil). The CO2 content was completely removed from both guarana drinks by vigorous shaking using a magnetic bar and a stirring plate in a container filled with the SD, after which the SD was offered to the animals at room temperature. Body weight and food and drink consumption were measured weekly. Cumulative food intake was calculated from the difference in weight before and after feeding. The average caloric food consumption was determined proportionally to food intake under the classic nutritional parameters: carbohydrate (4 kcal/g), protein (4 kcal/g), and fat (9 kcal/g).
Animals were bred and maintained in the animal care facility at the Experimental Monitoring Laboratory of Vila Velha University (UVV) under standard conditions in individual acclimatized plastic cages at ~22°C and 60% humidity under a 12-hour dark-light cycle. After 8 weeks of the diets, all animals were euthanized. All experimental procedures were performed in accordance with the guidelines for the care and handling of laboratory animals as recommended by the National Institutes of Health (NIH), and all protocols were approved by the Institutional Animal Care Committee (Protocol # 375/2016).
2.2. Blood Pressure Measurements
Systolic, diastolic, and mean blood pressure (BP) were measured using plethysmography of the tail (CODA Mouse Tail-Cuff Blood Pressure System, Kent Scientific Co., Connecticut, USA). Conscious mice were placed individually in a restraint that allowed free access to the tail and acclimated at 30°C for approximately 15 min to ensure adequate blood flow to the tail. BP measurements were performed in the morning in a quiet laboratory, and the mice were kept calm and handled by the same observer. Thirty-five measurements were recorded over 15 min, and valid readings (at least 10) were averaged to determine the values for BP. All measurements were recorded after a 3-day measurement acclimatization schedule on the first and last day of the diet.
2.3. Oral Glucose Tolerance Test (OGTT)
On the last day of the diet, basal glycemia was measured after 6 hours of total food and drink deprivation according to Andrikopoulos et al. [24] and Ayala et al. [25]. Fasted mice were orally administered 2 g of glucose/kg body weight, and blood glucose was checked through tail blood extraction at regular intervals (0, 20, 40, 60, and 120 min) as graphically indicated. For this, animals were placed in a restraint, and the last 4 mm of the tail was covered with clean gauze swabbed with lidocaine cream (4%). After 2 min, the anesthetic was removed with ethanol solution (70%), and the last 1 mm of the tip of the tail was then removed using sterilized surgical scissors. Then, the tail was gently massaged to ensure adequate blood flow. The total glucose response vs. time was evaluated by area under the curve (AUC) using Prism software (Prism 6.0, GraphPad Software Inc., San Diego, CA, USA).
2.4. Clinical Biochemistry Parameters
The blood was collected from the heart (right ventricle) of mice euthanized with sodium thiopental (100 mg/kg, i.p.). The blood was then centrifuged at 4,000 g for 10 min. Then, the serum was separated and kept at −80°C until analysis. Serum concentrations of glucose, triglycerides, total plasma cholesterol, high-density lipoprotein (HDL), uric acid, urea, creatinine, C-reactive protein (CRP), and homocysteine and the activity of AST and ALT were determined by an automatic biochemical analyzer (AU 680, Olympus/Beckman Coulter, Munich, Germany) according to the manufacturers’ instructions. Standard controls were run before each determination. The levels of non-HDL lipoprotein were calculated by subtracting HDL from total serum cholesterol.
For the determination of enzymuria, as described by Fang et al. [26], urine samples were collected before euthanasia for the measurement of glutamyl transpeptidase (GGT) and creatinine. The samples were kept at −80°C before being assayed. All measurements were performed by standard laboratory methods using the same automatic biochemical analyzer.
2.5. Morphological Analysis of Aortic Lipid Deposition
The analysis of aortic lipid deposition was performed as previously described [20, 21, 27]. After euthanasia and venous blood collection, the animals were perfused with PBS-formaldehyde (4%; pH 7.4; 0.1 mol/L) (Merck S.A., São Paulo, Brazil) via the left ventricle, and the thoracic cavity was opened. Briefly, en face aortic surfaces were opened, fixed in ethylene vinyl-acetate (EVA), and stained with Oil Red O (Sigma-Aldrich, St. Louis, MO) to identify neutral lipids; images were captured using a digital camera. Then, quantification was performed using imaging software (ImageJ 1.35d, USA, public domain software from National Institutes of Health). Finally, the aortic lesion area was measured by a “blind” investigator.
2.6. Measurement of Oxidative Stress in the Blood (ROS Production)
ROS were quantified by flow cytometry analysis according to previous protocols [21, 28]. To estimate the bioavailability of intracellular superoxide (•O2-) and hydrogen peroxide (H2O2), dihydroethidium (DHE, 160 μM) and 2,7-dichlorofluorescein diacetate (DCF, 20 mM) were, respectively, added to a cell suspension (106 cells) and incubated for 30 min (at 37°C) in the dark. In relation to highly reactive oxygen species (hROS), such as peroxynitrite and hydroxyl radicals, they were selectively measured using HPF (2-[6-(4-hydroxy)phenoxy-3H-xanthen-3-on-9-yl] benzoic acid). After washing the cells and resuspension in PBS, the samples were analyzed using a flow cytometer (FACSCanto II, BD Biosciences, San Jose, CA). All the data were obtained through the FACSDiva software (BD Biosciences, San Jose, CA), and histograms were generated using the FCS Express software (De Novo Software, Thornhill, Ontario). For the measurement of the probes DHE, DCF, and HPF fluorescence, ten thousand events per sample were explored for each analysis in monoplicate with excitation occurring at 488 nm. For •O2- quantification, DHE fluorescence was measured through a bandpass filter at an excitation/emission wavelength of 585/42 nm, whereas DCF and HPF fluorescence were analyzed through 530/30 nm. Finally, the results were reported as the median fluorescence intensity (MFI).
2.7. Cell Viability
This protocol was analyzed through propidium iodide (PI) as previously described [29]. A total of one million cells were exposed to PI (2 μL) in the medium (5 min at 25°C in the dark).
After the washing step with PBS, the blood cells were submitted to flow cytometry using a FACSCanto II Flow Cytometer (BD Biosciences). For viability analysis, samples were obtained in triplicate. A total of 10,000 events were analyzed for each experiment at 488 nm excitation whereas PI fluorescence was observed through a bandpass filter at 585/42 nm. All the data are represented as the proportion (%) of unstained/viable cells [29].
Apoptotic blood cells were analyzed according to the protocol of our lab (Porto et al. [28] and Bôa et al. [29]). In brief, cells were washed two times with PBS and adjusted to 0.5 mL with the binding buffer (500,000 cells). After the incubation with annexin V-FITC and PI (at 25°C in the dark for 15 min), the cells were detected using a FACSCanto II (BD Biosciences) flow cytometer. Apoptotic cells were identified by the positive staining for annexin V ().
2.8. Advanced Oxidation Protein Products (AOPP) in Plasma, Liver, and Stomach
The analyses of AOPP were performed according to Witko-Sarsat et al. [30] and Coutinho et al. [21] using spectrophotometry with a microplate reader (SpectraMax 190, Molecular Devices, Sunnyvale, CA, USA). Forty microliters of plasma, liver, or stomach homogenate (diluted at 1: 10, 1: 30, and 1: 10, respectively) was solubilized 1: 5 in PBS or chloramine-T standard solutions (0 to 100 μmol/L). Then, the samples were placed in each well of a 96-well microtiter plate (BD Discover Labware, Lincoln Park, NJ, USA), and 10 μL of 1.16 mol/L potassium iodide (KI, Sigma-Aldrich) was added, followed by the addition of 20 μL of acetic acid. The absorbance of the reaction mixture was immediately read at 340 nm in a microplate reader against a blank containing 200 μL of PBS, 10 μL of KI, and 20 μL of acetic acid. Finally, the AOPP was determined when the correlation coefficient was >0.95. The concentrations were presented in μmol/mg of total protein as determined by the Bradford method [31] from dilutions of 1: 200 for plasma, 1: 50 for liver, and 1: 4 for stomach for each measurement.
2.9. Comet Assay
DNA damage was assessed using an alkaline comet assay (single-cell gel electrophoresis), based on Singh et al. [32] following minor adaptations established from our laboratory [33, 34]. Briefly, histological slides were precoated with 1.5% normal melting point agarose in water in a water bath at 65°C. Subsequently, 10 μL of blood cell suspension was embedded in 110 μL of 1% low melting point agarose in PBS at 37°C and spread on agarose-precoated slides using coverslips. The experiment was conducted in duplicate, i.e., two slides per animal. After gelling at 4°C for 30 min, the coverslips were removed, and the slides were incubated in freshly prepared lysis solution (in mmol/L: 2500 NaCl, 100 EDTA, 10 Tris, and 34 N-lauroylsarcosine sodium, adjusted to pH 10.0-10.5, using freshly added 1% Triton X-100 and 10% DMSO) for 1 hour at 4°C. Then, the slides were placed in an electrophoresis chamber filled with freshly prepared alkaline buffer (in mmol/L: 300 NaOH and 1 EDTA, pH >13) for 40 min at 4°C and conducted at 300 mA and 32 V (1 V/cm) for 20 min. Afterwards, the slides were neutralized with a 0.4 mol/L Tris buffer (pH 7.5) for 5 min (3 times) and finally dried with cold pure methanol (-20°C) for fixation. Migration of DNA fragments towards the anode creates a comet “tail,” visualized by staining with ethidium bromide (20 μg/mL, Sigma-Aldrich). Immediately afterwards, images were obtained at a magnification of 20x using a fluorescence optical microscope (Eclipse TI, Nikon Instruments Inc., Melville, NY, USA) equipped with excitation (420-490 nm) and barrier (520 nm) filters. The coded images were acquired using a CCD camera (Nikon) and were analyzed with the CASP 98beta program (public domain).
Among the several parameters provided by the CASP program, we used the percentage of DNA in the tail and the tail moment for analysis of DNA damage. The images of 50 randomly selected nucleoids from each sample were analyzed for each animal. During the image analysis, nucleoids without clearly identifiable heads, showing overlap, or containing an artifact were excluded as a quality control measure.
2.10. Liver and Stomach Histology
For detection of neutral lipids for morphometric analyses, the organs were isolated and fixed in buffered formaldehyde solution (4%) for at least 2 days. The samples were cross-sectioned at 8 μm thicknesses in a -25°C cryostat (Jung CM1860; Leica, Wetzlar, Germany). Sections were then mounted on gelatin-coated slides and colored with Oil Red O or hematoxylin-eosin (Sigma-Aldrich). Finally, all images were captured using a camera (AxioCam ERc 5 s, Carl Zeiss, Germany) coupled to an optical microscope (AX70, Olympus Corporation, Japan) with a 40x objective and quantified using ImageJ software (NIH, USA). For each analysis, 10 distinct fields per animal were randomly used to calculate the average percentage of the red area. All analyses were performed by a “blind” researcher.
2.11. Statistical Analysis
All data are expressed as the (standard error of the mean). For the statistical analysis, two-way ANOVA was performed to analyze differences in biometric parameters and chow, liquid, and caloric intake. For the other analyses, we used one-way ANOVA followed by post hoc Tukey’s test using Prism software (Prism 6.0, GraphPad Software Inc., San Diego, CA, USA). A value of was considered statistically significant.
3. Results
3.1. Biometric Parameters and Chow, Liquid, and Caloric Intake
Figure 1 summarizes the general parameters of food and liquid intake, caloric consumption, and body weight during the 8-week follow-up period. The GSD group exhibited hypophagia (~50%, , Figure 1(a)) and polydipsia (~2.5-fold, , Figure 1(b)) when compared to the control and Z-GSD groups, without a difference in caloric consumption and body weight between groups.


3.2. Lipid Profile and En Face Analysis
Figure 2 represents the serum lipid profile and lipid deposition in the aortas of all groups studied. We observed an augmentation in non-HDL cholesterol in GSD mice (, , ) compared with the control and Z-GSD groups (, , and , , respectively) without a difference in the level of HDL and triglycerides (Figure 2(a)). Figure 2(b) summarizes the results of typical analyses of the aorta, showing that GSD mice had significantly increased lipid deposition, by ~60% (), compared with the control group (). On the other hand, in the aortas obtained from Z-GSD mice, the lipid deposition was similar to that under control conditions (, ).


3.3. Other Serum Biochemical Parameters
Table 1 shows the results of other relevant biochemical analyses of the 3 groups studied after 8 weeks of the diets. Interestingly, we highlighted that the nonfasting glycemic level was not different between the groups. Surprisingly, in the OGTT, the GSD and Z-GSD groups showed augmented sensitivity to insulin (~30%) compared with control mice (). In parallel, the renal biomarkers worsened due to Z-GSD supplementation: serum creatinine increased significantly (~65%, ) in the Z-GSD group compared to the control and GSD groups. Moreover, the GGT/urinary creatinine was also higher in the Z-GSD group than in the control and GSD groups (~100 and 65%, respectively, ). No differences were observed between hepatic (ALT and AST) and nonspecific inflammatory (CRP) biomarkers.
3.4. Blood Pressure Determination
As shown in Figure 3, the GSD group exhibited significant increases in mean, systolic, and diastolic BP (+19, 22, and 24 mmHg, respectively, ) compared with the control group. On the other hand, the Z-GSD mice showed increases in only systolic and diastolic BP (18 and 17 mmHg, respectively, ). No change in heart rate was observed between groups (data not shown).

3.5. Oxidative Stress Biomarkers in Blood Cells
Based on previous data showing that high levels of ROS are crucial for atherosclerosis [19, 21, 35–37] and hypertension [38], we evaluated the intracellular ROS levels in white blood cells in all groups studied. As illustrated in Figure 4(a), we showed that GSD supplementation increased •O2- production by ~50% () compared to that in the control mice (•O2-: , ). Interestingly, Z-GSD prevented the overproduction of ROS (•O2-: , H2O2: ), producing levels similar to that in the control group (H2O2: , ). In relation to hROS, we did not detect differences between groups (control: , GSD: , Z-GSD: , ). Concerning other serum biomarkers of oxidative stress, we demonstrated that the GSD group had increased plasma homocysteine (~3-fold, Figure 4(b)) and AOPP levels (~2.5-fold, Figure 4(c)) compared to the Z-GSD group ().


3.6. Genotoxic Effect
The assessment of genotoxic stress by the comet assay indicated greater DNA damage in the GSD group (, ) than in control mice (), and this damage was significantly reduced in the Z-GSD group () (Figures 4(d) and 4(e)). Another parameter measured was the comet tail moment, the product of the tail length and the portion of total DNA in the tail [34, 39]. This analysis demonstrated an increase in DNA fragmentation in the GSD group (, ) compared with the control and Z-GSD mice ( and , respectively) (Figure 4(f)).
3.7. Cell Viability and Apoptosis in Blood Cells
Apoptosis was investigated in the same blood cells using PI and annexin V staining and flow cytometry analysis. Figure 5(a) shows typical dot plots for each group. Our results in Figure 5(b) indicate that GSD increased the number of apoptotic cells () by 80% () compared with that of control mice (). On the other hand, the Z-GSD group showed a profile similar to that of the control mice (, ). Concerning cell viability (Figure 5(c)), the GSD group showed impaired cell viability () compared with that of the other groups (control: and Z-GSD: , ).


3.8. Oxidized Protein and Histological Analysis in Liver and Stomach
We also investigated the impact of chronic guarana consumption on oxidative damage in the liver and stomach of LDLr-/- mice. The levels of oxidized proteins were increased in the GSD group compared to control animals, in both the liver (25%, , Figure 6(a)) and stomach (75%, , Figure 6(c)). Interestingly, the Z-GSD group and the control mice had similar profiles () in both organs (Figures 6(a) and 6(c)). Moreover, the GSD group showed greater lipid deposition (120%, ) in liver cells (Figure 6(b)) compared with that of the control group. The Z-GSD group showed no difference compared to the other groups (). In regard to stomach damage (Figure 6(d)), we observed that only the GSD group developed atrophy and degeneration in gastric glands.

4. Discussion
In the present study, we showed for the first time that long-term consumption of the regular classic guarana beverage (GSD) by adult dyslipidemic mice resulted in an increase in hypercholesterolemia, aortic lipid deposition, BP, oxidative stress, and DNA fragmentation, as well as apoptosis in mononuclear cells, and greater hepatic and gastric injuries (even without weight gain or hyperglycemia). Interestingly, the zero guarana soft drinks (Z-GSD) did not cause most of the described negative effects, except those on hemodynamic and renal parameters.
First, although several clinical studies have indicated a positive association between sugar-sweetened beverage consumption and the risk of obesity [40–42], our results, as well as other related experimental findings [1, 12, 43], have not confirmed the clinical hypothesis that the regular consumption of sugar-sweetened beverages could induce weight gain. It is important to emphasize that, contrary to rational human behavior, the animals exposed to classic guarana halved their consumption of food, thereby normalizing their caloric intake, as previously described by Otero-Losada et al. [12], who investigated cola beverage consumption in the same exposure period. Though some researchers suggest that consumption of nonnutritive sweeteners may increase appetite [10, 44, 45], our results using zero guarana SD do not show modified food intake or body weight. Therefore, our data reinforce recent experimental findings using diet cola, which had similar results [10–12], and suggest that an increase in food consumption associated with aspartame-sweetened drinks in humans might be related to psychological influences (eating in excess) that apparently did not occur in our experimental animals.
It is well documented that consumption of SD is linked to cardiometabolic risk factors [46–48]. However, the parameters of the traditional serum biochemical profile (e.g., glycemia, triglycerides, and cholesterol) under SD exposure are still conflicting in experimental [1, 10, 12] and clinical studies [45–51]. Our results showed that GSD, but not Z-GSD, increased only non-HDL cholesterol, maintaining triglyceride and glycemic control. A possible explanation for the euglycemic control is that drinks containing a moderate amount of caffeine [1, 8, 52] and/or acesulfame K [12, 53] might stimulate insulin secretion and/or upregulate glucose transporters, which is partially corroborated by the improvement of the OGTT profile detected in our study. Despite the discrete metabolic impact observed, we demonstrated several consequences of long-term nonzero guarana consumption, described as follows.
The exact influence of chronic SD consumption on atherosclerosis is poorly known. Until now, experimental data have been collected only for cola beverages [12, 54]. Therefore, the proatherogenic effect observed with GSD (but not with Z-GSD) opens new perspectives about this issue, justified by the following points: (1) it is possible to induce significant aortic lipid deposition in aged female LDLr-/- mice under only sugar-sweetened beverage exposure without a high-fat diet, which opposes the classical methodology [21, 55]; (2) the atherogenesis might be more related to the excessive exposure to free sugars than other substances (nonnutritive sweeteners) in these SD, as observed in a study using cola beverages that detected atherogenesis after exposure to even light cola drinks [54]; and (3) glycemia per se may not be sufficient to evaluate the impact of chronic exposure to carbohydrate-rich beverages, verified by hemodynamic parameters, redox homeostasis, and cellular/tissue losses, as detected in our study.
Concerning hemodynamic parameters, several reports have shown that hypertension is a major contributor to the development of cardiovascular diseases, which are associated with endothelial dysfunction and altered contractility [27, 56, 57]. For the first time, our study demonstrated an increase in BP due to chronic guarana SD consumption, which could be involved in the development of hypertension. Although we and others have not yet explored the vascular reactivity of animals exposed to classic SD, some studies have previously shown abnormal reactivity in animals fed a high fructose diet [58, 59], justified at least in part by an increase in angiotensin II and downregulation of eNOS [60]. On account of the present data, we suggest that other substances may be involved in the potential development of hypertension because the group treated with an artificially sweetened drink (Z-GSD) also showed a rise in BP. Among them, we cannot discard the role of aspartame (which contains 50% phenylalanine), a relevant precursor of highly vasoactive substances (i.e., dopamine, noradrenaline, and adrenaline) [61], and caffeine, an enhancer of adrenergic activity [10].
It is well established that oxidative stress is a central phenomenon in the progression of cardiovascular [19, 21, 23, 27, 35, 62] and other age-related diseases [63, 64]. At the same time, several studies have shown that hyperglycemia increases ROS production mainly via mitochondrial dysfunction and endoplasmic reticulum stress [28, 65–67]. Therefore, we decided to investigate the impact of ROS generation and possible cell/tissue oxidative damage under exposure to guarana drinks. For the first time, we showed that classic guarana soft drinks (GSD) present a prooxidative effect by both direct (flow cytometry) and indirect (homocysteine, AOPP, and DNA fragmentation) detection and that all these factors may influence, at least in part, the increase in BP and the lipid deposition observed in our study [35, 68–70]. Additionally, we previously showed that oxidative damage had major consequences, such as elevation of apoptosis and decrease of blood cell viability, whose mechanisms may be through established pathways (e.g., chromosomal cleavage, telomere shortening, and/or activation of caspases) [71–73]. Moreover, we cannot exclude the possibility that hyperhomocysteinemia observed under exposure to guarana might be another direct contributor to hypertension [64], DNA damage, and apoptosis activation, as observed by others [74, 75].
Until the present study, there was no evidence that guarana SD could contribute to liver or gastric damage. In parallel, only a few studies have demonstrated a potential risk of hepatotoxicity under chronic exposure to aspartame [76, 77] or acesulfame K [12]. Thus, our data clarify this question by demonstrating that the excessive consumption of carbohydrates (but not guarana per se) is the main contributor to steatosis and oxidative stress in the liver. These data are supported by previous research showing that fructose and glucose are important inducers of de novo lipogenesis and ROS production [78, 79]. A similar pattern of impacts was observed for the stomach, revealing that the greatest damage occurs in relation to carbohydrates (fructose, glucose, and sucrose) rather than to artificial sweeteners (acesulfame K or aspartame). It is important to emphasize that all damages previously described were generated in normoglycemic conditions, even in the case of chronic exposure to classic SD (rich in carbohydrates). Thus, it is suggested that before classical metabolic alterations are observed clinically, several types of oxidative damage by SD may occur. This should be considered an alert relevant to public health policies.
Last, but not least, the only organ that showed greater damage from zero guarana SD was the kidney, with possible loss of glomerular filtration and tubular injury, demonstrated by creatininemia and increased enzymuria, respectively, according to previous reports [26, 80]. In this case, we suggest that the renal damage might have been generated by aspartame. Recently, some studies have demonstrated that long-term intake of aspartame may develop oxidative stress in the rat kidney through the dysregulation of glutathione homeostasis [81]. However, future investigations will be necessary to explore the impact of acesulfame K or other substances.
Some limitations of our investigation should be considered. First, the lack of monitoring the estrous cycle in adult female mice does not allow us to speculate about the influence of sex hormones on the present results. Second, since this study with SD was carried out for the first time with LDLr-/- mice, the comparison with the ApoE-/- mouse model would not be appropriate. Third, we do not yet know if all parameters would be normalized after washout for months, indicating the need for more investigations to confirm or rule out the existence of nonreversible, chronic effects after prolonged consumption of these beverages.
5. Conclusions
Our results demonstrate that long-term administration of the classic guarana beverage causes adverse prooxidant outcomes at serum, vascular, hepatic, and gastric levels, at least in part due to free sugar exposure but not to guarana extract per se. This experimental investigation may provide a basis for further experimental and clinical studies to better explore the association between the consumption of soft drinks and metabolic diseases.
Abbreviations
| ALT: | Alanine aminotransferase |
| ANOVA: | Analysis of variance |
| AOPP: | Advanced oxidation protein products |
| AST: | Aspartate aminotransferase |
| AUC: | Area under the curve |
| BP: | Blood pressure |
| FITC: | Fluorescein isothiocyanate |
| GGT: | Glutamyl transpeptidase |
| GSD: | Normal/classic guarana soft drink |
| Z-GSD: | Zero guarana soft drink |
| HDL: | High-density lipoprotein |
| i.p.: | Intraperitoneal |
| kcal: | Kilocalories |
| LDLr-/-: | Low-density lipoprotein receptor knockout mice |
| MFI: | Median fluorescence intensity |
| min: | Minutes |
| NIH: | National Institutes of Health |
| OGTT: | Oral glucose tolerance test |
| PBS: | Phosphate-buffered saline |
| CRP: | C-reactive protein |
| PI: | Propidium iodide |
| ROS: | Reactive oxygen species |
| SD: | Soft drinks |
| SEM: | Standard error of the mean |
| UVV: | Vila Velha University. |
Data Availability
All data used to support the findings of this study are included within the article.
Ethical Approval
All experimental procedures were performed in accordance with the guidelines for the care and handling of laboratory animals as recommended by the National Institutes of Health (NIH), and all protocols were approved by the Institutional Animal Care Committee (Protocol # 375/2016).
Conflicts of Interest
The authors disclosed no conflict of interest.
Authors’ Contributions
LAC contributed to the design of the study and carried out the experimental analysis, acquisition of data, and interpretation of the data. BPP contributed to the experimental analysis and acquisition of data. MLP and SSM made it possible to perform flow cytometry analysis for the evaluation of ROS and apoptosis/cell viability. TUA participated in the design of the study and supervised the care and treatment of the groups of animals. JPO, ALEMA, and BVN carried out the experimental histological analysis and acquisition of data. MCT participated in the critical revision of the manuscript. ECV made it possible to perform flow cytometry analysis and participated in the critical revision of the manuscript. BPC contributed to the comet assay analysis and critical revision of the manuscript. TMCP was the supervisor of the first author, and he designed the study, carried out the experimental analysis, and drafted and critically reviewed the manuscript. All authors read and approved the final version of the manuscript. All authors consented to the publication of the manuscript.
Acknowledgments
The authors are grateful to the Tommasi Laboratory for use of their facilities. The authors also acknowledge the support provided by the National Council for Scientific and Technological Development (Grants CNPq-445080/2014-0 and CNPq-445736/2014-3) and the State Agency for the Development of Science and Technology (Grants FAPES-239/2016 and FAPES-0606/2015).
https://www.medicalnewstoday.com/articles/297600#summary
Is Coca-Cola bad for you?
People consider sugary drinks to be a significant contributor to many health conditions, including obesity, type 2 diabetes, and tooth decay. Research has shown that drinking a can of Coca-Cola can have damaging effects on the body within an hour.
According to the Centers for Disease Control and Prevention (CDC), about half of the United States population will drink at least one sugary beverage on any given day. Young adults are the most regular consumers of sugary drinks.
There are 37 grams (g) of added sugar, which equates to almost 10 teaspoons (tsp), in a single can of cola.
For optimal health, the World Health Organization (WHO) recommend consuming no more than 6 tsp of added sugar daily. By drinking just one serving of cola a day, a person will easily exceed this amount.
A 2015 study attributed 184,000 global deaths each year to the consumption of sugary drinks.
In this article, we look at the effects of cola on the body.

An infographic by the British pharmacist Niraj Naik shows the damage that a 330 milliliter (ml) can of Coca-Cola can inflict on the body within 1 hour of consumption. Naik based the infographic on research by health writer Wade Meredith.
According to Naik, the intense sweetness of Coca-Cola resulting from its high sugar content should make a person vomit as soon as it enters the body. However, the phosphoric acid in the beverage dulls the sweetness, enabling people to keep the drink down.
Blood sugar levels increase dramatically within 20 minutes of drinking the cola, explains Naik, causing a burst of insulin. The liver then turns the high amounts of sugar into fat.
Effects similar to heroin
Within 40 minutes, the body has absorbed all of the caffeine from the cola. This caffeine causes the pupils to dilate and the blood pressure to increase. By this point, the Coca-Cola has blocked the adenosine receptors in the brain, preventing drowsiness.
Just 5 minutes later, the production of dopamine has increased. Dopamine is a neurotransmitter that helps control the pleasure and reward centers of the brain. According to the infographic, the way that Coca-Cola stimulates these centers is comparable to the effects of heroin. It triggers a person’s urge to drink another can.
An hour after drinking the beverage, a sugar crash will begin, causing irritability and drowsiness. The body will have cleared the water from the cola, along with vital nutrients, in the urine.
According to Naik, the infographic applies not only to Coca-Cola but to all caffeinated fizzy drinks.
“Coke is not just high in high fructose corn syrup, but it is also packed with refined salts and caffeine,” writes Naik on his blog, The Renegade Pharmacist.
“Regular consumption of these ingredients in the high quantities you find in Coke and other processed foods and drinks can lead to higher blood pressure, heart disease, diabetes, and obesity. […] However, a small amount now and then won’t do any major harm. The key is moderation!”
In a press statement, a spokesperson for Coca-Cola says that the beverage is “perfectly safe to drink and can be enjoyed as part of a balanced diet and lifestyle.”
In 2018, a mini literature review highlighted more ways in which sugary drinks can affect health.
The review authors examined the effects of sugar sweetened beverages on the brain. They found that these drinks increased levels of certain compounds and chemicals that interfered with brain activity, increasing the risk of stroke and dementia.
They also found that regularly consuming sugary drinks may affect the quality and duration of a person’s sleep cycle. Some compounds also had effects on memory and motor coordination, which may contribute to the development of attention deficit hyperactivity disorder (ADHD) in children.
However, many of the studies in this review took place in rats. The full extent of the effects of sugary drinks on humans is not yet clear.
The authors of a 2018 study involving 2,019 participants found that they could not even rule out the consumption of diet sodas as a risk factor for diabetes. They note that their findings support the suggestion that sugar-sweetened beverages, such as cola, play a role in the development of this chronic disease.
A 2016 study on rats found that the rodents that drank Coca-Cola showed signs of decreased kidney and liver function in comparison with the rats that did not drink soda.
Again, further research would be necessary to confirm the effects of Coca-Cola in humans.
Here, learn about the sugar content of a range of popular foods and drinks.
Effects of Pepsi and coca cola on oxidative stress, serum calcium, renal function tests , some haematological variables and organ weights in albino rats

Abstract
07 August 2017
Damaging Free Radicals: the hidden dangers of exercise and the possible remedy that’s already in your fridge

- Exercising generates highly unstable molecules called free radicals which attack essential lipids, proteins, and nucleic acids in our body’s cells
- Vitamin C, found in pure orange juice, contributes to the protection of cells from oxidative stress induced by exercise
We all know that exercise is great for our physical and mental wellbeing, but a lesser known hazard of hitting the gym or committing to a summer jogging programme is that intense or strenuous exercise puts our cells at risk of oxidative stress.
This is a process whereby muscles under strain release toxic, unstable molecules called free radicals which can target and damage essential structures in the body’s cells. The long-term effect of this may be increased inflammation, which is associated with several conditions such as diabetes or cardiovascular disease.
However, celebrity personal trainer Nicola Addison, whose clients have included Elle MacPherson and Daisy Lowe, urges Brits not to be deterred from their summer fitness regime. “This time of year I often see clients who want to get in shape very quickly ahead of a summer holiday," she said.
"The problem is that very intense exercise does have its risks. Free radicals may sound scary but there are simple steps you can take to protect your cells from oxidative stress and still enjoy getting fit.”
And the ally that can help with lowering this oxidative stress is a familiar friend: vitamin C. Consuming 200mg of vitamin C from orange juice and fruit and vegetables helps maintain the normal functioning of the immune system during and after intense physical exercise.
“There is no need to splash out on a premium sports drink” says Nicola. "A 150ml glass of pure orange juice is not only hydrating but it also contains all your recommended daily amount of vitamin C, an antioxidant that plays a major role in the protection of cells from free radicals.”
Containing no added sugars, a 150ml glass of pure orange juice provides 4% of a woman’s daily calorie intake based on a 2,000 calorie diet (3.2% of calories for men, based on a 2,200 calorie diet). It is also a source of potassium, which helps to reduce tiredness and fatigue, and contributes to the maintenance of healthy blood pressure, and folate, a B vitamin vital for cell division.
Furthermore, an analysis of six years’ worth of existing National Diet and Nutrition Survey (NDNS) data released earlier this year revealed that people who drink pure fruit juice have a better health profile than those who do not, with the former having a lower waist circumference and a lower average BMI than the latter, making pure orange juice the perfect partner in your mission to get in shape this summer.


https://onlinelibrary.wiley.com/doi/abs/10.1002/jbt.22022
Effects of sodium benzoate, a commonly used food preservative, on learning, memory, and oxidative stress in brain of mice
Effects of sodium benzoate, a commonly used food preservative, on learning, memory, and oxidative stress in brain of mice
Abstract
Sodium benzoate (SB) is a widely used preservative and antimicrobial substance in many foods and soft drinks. However, this compound is generally recognized as safe food additives, but evidence has suggested that a high intake of SB may link to attention deficit‐hyperactivity disorder in children. Present study investigate the effects of oral administration of different concentrations of SB (0.56, 1.125, and 2.25 mg/mL) for 4 weeks, on the learning and memory performance tests, and also the levels of malondialdehyde (MDA), reduced glutathione (GSH), and acetylcholinesterase activity (AChE) in the mouse brain. The results showed that SB significantly impaired memory and motor coordination. Moreover, SB decreased reduced GSH and increased the MDA level in the brain significantly (P < 0.001). However, nonsignificant alteration was observed in the AChE activity. These findings suggest that short‐term consumption of SB can impair memory performance and increased brain oxidative stress in mice.
https://www.sciencedirect.com/science/article/abs/pii/S1871402117302965
Sugar intake in Sudanese individuals was associated with some features of the metabolic syndrome: Population based study
https://www.magonlinelibrary.com/doi/abs/10.12968/denu.2015.42.6.507
The truth about sugar
Abstract
Sugars are used by the industry to enhance the attractiveness of foods and drinks. These added sugars, or ‘free sugars’, are not easily identified in food or drink labels. Certain manufactured foods and drinks with ‘safe’ names, such as dried fruit and fruit juice, still contain free sugars and can be confusing. Guidance states that daily consumption of free sugars should be less than 10% of total energy intake (no more than 5% in the UK). However, it is found that both tooth decay and obesity are associated with consumption of free sugars in large quantities and at inappropriate times.
CPD/Clinical Relevance: When giving dietary advice to dental patients, it should be emphasized that free sugars hidden in certain foods and drinks are directly linked to tooth decay and obesity.
https://www.nature.com/articles/1602866
Direct and indirect cellular effects of aspartame on the brain
European Journal of Clinical Nutrition 62, 451–462(2008)
Abstract
The use of the artificial sweetener, aspartame, has long been contemplated and studied by various researchers, and people are concerned about its negative effects. Aspartame is composed of phenylalanine (50%), aspartic acid (40%) and methanol (10%). Phenylalanine plays an important role in neurotransmitter regulation, whereas aspartic acid is also thought to play a role as an excitatory neurotransmitter in the central nervous system. Glutamate, asparagines and glutamine are formed from their precursor, aspartic acid. Methanol, which forms 10% of the broken down product, is converted in the body to formate, which can either be excreted or can give rise to formaldehyde, diketopiperazine (a carcinogen) and a number of other highly toxic derivatives. Previously, it has been reported that consumption of aspartame could cause neurological and behavioural disturbances in sensitive individuals. Headaches, insomnia and seizures are also some of the neurological effects that have been encountered, and these may be accredited to changes in regional brain concentrations of catecholamines, which include norepinephrine, epinephrine and dopamine. The aim of this study was to discuss the direct and indirect cellular effects of aspartame on the brain, and we propose that excessive aspartame ingestion might be involved in the pathogenesis of certain mental disorders (DSM-IV-TR 2000) and also in compromised learning and emotional functioning.
Introduction
The artificial dipeptide sweetener, aspartame (APM; L-aspartyl-L-phenylalanine methyl ester), is present in many products in the market, especially in unsweetened or sugar-free products. People trying to lose weight or patients with diabetes, including children, frequently use these products. A recent observation indicated that aspartame is slowly making its way into ordinary products used every day, which do not carry any indication of being for people on diets or diabetics. Thus, aspartame is used not only by the above-mentioned group of people, but also by unsuspecting individuals. Although there is concern and research evidence suggesting possible adverse neurological and behavioural effects due to aspartame's metabolic components (phenylalanine, aspartic acid (aspartate), diketopiperazine and methanol), which are produced during its breakdown, research suggests that aspartame is not cytotoxic. This debate still continues 20 years after the FDA had approved the use of aspartame. As seen later in the literature study, phenylalanine may cross the blood–brain barrier and cause severe changes in the production of very important neurotransmitters. Methanol breaks down into formate, which in turn is very cytotoxic and can even cause blindness.
The effects of aspartame have been studied on various species, including humans, rats, mice and rabbits. Most studies described in the literature have a macroscopic approach. If no adverse effects are visible after a single large administered dose of aspartame, it is believed that aspartame has no effect. Further studies are not carried out microscopically to demonstrate possible adverse effects on the cellular basis. Thus, results obtained from different studies vary from severe adverse effects to none observed.
The aim of this study was to investigate the direct and indirect cellular effects of aspartame on the brain, and we propose that excessive aspartame ingestion might be involved in the pathogenesis of certain mental disorders (DSM-IV-TR 2000) and also in compromised learning and emotional functioning. Most diet beverages and food products currently in the market contain aspartame as an artificial sweetener. However, controversy surrounds the effects of this non-nutritive artificial sweetener, as it is made up of three components that may have adverse effects on neural functioning, particularly on neurotransmitters (Figure 1), neurons and astrocytes.

Classification of neurotransmitters.
In light of the possible adverse effects of aspartame, the research questions directing this study are formulated as follows: What are the direct and indirect cellular effects of aspartame on the brain? How might excessive aspartame ingestion contribute to the pathogenesis of certain mental disorders? What are the implications for early brain development, emotional status and learning following high ingestion of aspartame?
Aspartame is composed of phenylalanine (50%), aspartic acid (40%) and methanol (10%). The first two are known as amino acid isolates. It has been reported that consumption of aspartame could cause neurological and behavioural disturbances in sensitive individuals (Anonymous, 1984; Johns, 1986). Headaches, insomnia and seizures are some of the neurological disturbances that have been encountered, and this may be accredited to changes in regional brain concentrations of catecholamines, which include norepinephrine, epinephrine and dopamine (Coulombe and Sharma, 1986), all important neurotransmitters regulating life-sustaining functions. The effects of phenylalanine, aspartic acid and methanol are first reviewed, followed by a discussion of altered neurotransmitter functioning, that is dopamine, serotonin, glutamate, γ-aminobutyric acid (GABA), and acetylcholine. The discussion is concluded with implications for early brain development, emotional status and learning following high ingestion of aspartame.
Effects of phenylalanine
Phenylalanine not only plays a role in amino acid metabolism and protein structuring in all tissues, but is also a precursor for tyrosine (Hawkins et al., 1988), DOPA, dopamine, norepinephrine, epinephrine (Ganong, 1997), phenylethylamine (Young, 1988) and phenylacetate (as phenylacetate interferes with brain development and fatty acid metabolism). Phenylalanine also plays an important role in neurotransmitter regulation (Caballero and Wurtman, 1988).
Phenylalanine can follow one of the two pathways of uptake in the body. A part is converted into tyrosine (a non-essential amino acid) in the liver (Caballero and Wurtman, 1988) by the enzyme phenylalanine hydroxylase (Figure 2a) The remaining portion of phenylalanine (not converted in the liver) will bind to a large neutral amino acid transporter (NAAT) to be carried over the blood–brain barrier (BBB) (Figure 2b). A large number of compounds, including phenylalanine and tyrosine, compete with each other for a binding site on the NAAT, because it is the only manner in which they can cross the BBB. Importantly, tyrosine cannot be synthesized in the brain and has have to enter the BBB via NAAT (Figure 2c) for production. Memory loss is thought to be due to aspartic acid and phenylalanine being neurotoxic without the other amino acids found in protein. These neurotoxic agents might cross the BBB and deteriorate the neurons of the brain (Mehl-Madrona, 2005).

(a) Production of tyrosine from phenylalanine. (b) Transport of tyrosine across the blood–brain barrier (BBB). (c) Co-transporter (NAAT) for transport of tyrosine and so on across the BBB. (d) Conversion of tyrosine into dopamine.
NAAT is also a co-transporter for phenylalanine, tryptophan (an important precursor for synthesis of serotonin), methionine and the branch-chained amino acids. All the above-mentioned amino acids (tyrosine, phenylalanine, tryptophan and methionine) compete for the NAAT transporter, so a large quantity of one amino acid in the blood stream will occupy most of this transporter. This results in a phenylalanine overload in the surrounding areas, greatly limiting the amount of important amino acids (for example, tyrosine, tryptophan and methionine) entering the brain (Figure 2c). If high concentration of aspartame is taken through the daily diet, 50% of it is broken down to phenylalanine. Phenylalanine will then be either converted into tyrosine or cross the BBB as it is. Tyrosine is converted into dihydroxyphenylalanine (DOPA) once it is in the brain, by the enzyme tyrosine hydroxylase, with the help of the co-factors oxygen, iron and tetrahydrobiopterin (THB) (Figure 2d).
Dopamine, a catecholamine, is formed from DOPA by an aromatic amino acid decarboxylase. Tyrosine hydroxylase activity is inhibited by high concentrations of dopamine through its influence on the THB co-factor (negative feedback, Figure 2d). This system is very necessary to prevent large amount of dopamine being produced, as dopamine is an inhibitory neurotransmitter. However, if phenylalanine, as the main part of aspartame, competes with tyrosine for NAAT, a compromised dopamine production will result because phenylalanine will bind more frequently and freely than tyrosine owing to its higher concentration, and thus lead to lower concentrations of dopamine in the brain. After administration of aspartame to humans, the increases in blood levels of both phenylalanine and tyrosine have been well documented (Fernstorm, 1988; Filer and Stegink, 1988). Therefore, phenylalanine (formed by breakdown of aspartame) will increase in the brain owing to the ingestion of aspartame, and tyrosine will increase as a breakdown by-product of phenylalanine in the liver (Fernstorm, 1988; Filer and Stegink, 1988). Thus, aspartame and its components could potentially disrupt a wide range of processes in the body, including amino acid metabolism, protein structure and metabolism, nucleic acid integrity, neuronal function and endocrine balances.
Aspartame ingestion directly results in an increase inphenylalanine and tyrosine levels in the brain, which in turn leads to changes in the regional brain concentrations of catecholamines (for example, dopamine) (Fernstorm et al., 1983). According to Mehl-Madrona (2005) aspartame changes the dopamine level in the brain, affecting people suffering from Parkinson's disease. Bowen and Evangelista (2002) noted a substantial increase in the levels of plasma phenylalanine and aspartic acid after ingestion of aspartame. This increased phenylalanine, thereby causing a PKU (phenylketonuria) effect. PKU, also known as phenylpyruvic oligophrenia, is a disorder characterized by accumulation of phenylalanine and its keto derivatives in the blood, tissues and urine. This disorder is a direct result of a hereditary deficiency or absence of phenylalanine hydroxylase. As described previously, this enzyme is necessary for conversion of phenylalanine into tyrosine. The enzymes required for the reduction of circulating phenylalanine are overwhelmed, thus also interfering with other metabolic reactions that utilize these enzymes, resulting in the PKU effect. This causes reduced dopamine and serotonin production as the enzyme actions controlling numerous types of neurotransmitters (and their precursor amino acids) are debilitated by overdoses of the competitive circulating phenylalanine isolates (and aspartic acid isolates; Bowen and Evangelista, 2002).
Serotonin, an indolamine, causes powerful smooth muscle contraction (Ganong, 1997). Physiologically, it is also important for behaviour and control of sleep, temperature, appetite and neuroendocrine functions. Tryptophan, independently utilized for synthesis of serotonin in the brain, is transported across the BBB via NAAT. Therefore, if NAAT is occupied with phenylalanine, tryptophan will not be adequately carried across the BBB and serotonin production can ultimately be compromised (Figure 3).

Production of serotonin from tryptophan.
Aspartame administered orally in mice as single doses gave contradictory results; norepinephrine and dopamine (precursor of norepinephrine) concentrations in various brain regions increased significantly, and not as observed above. However, mice have a different metabolism for aspartame and its breakdown products are different from those of human beings; this could be the reason for these contradictory results. Sharma and Coulombe (1987) also analysed different regions for catecholamine (for example, dopamine) and indoleamine (for example, serotonin) neurotransmitters and their major metabolites. Results from this study indicated that single dose exposure increased adrenergic chemicals, which were not apparent after repeated dosing with aspartame. In contrast to the above observation, decreased serotonin and its metabolite, 5-hydroxyindoleacetate, was found in several regions (Sharma and Coulombe, 1987). The lowered levels of serotonin might cause the following:
A compromised BBB—due to lower levels of activity of cAMP, which plays an important role in the complexity of the tight junctions in the epithelial cells of the capillaries (Figure 3).
Lowered activity of the GABA transporters—thus GABA is absorbed at a lower rate into the astrocytes, which results in the continuous inhibition of depolarization of the postsynaptic membrane (Figure 4).
Figure 4 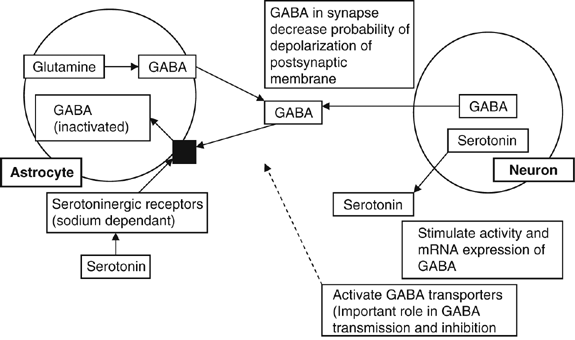
Effects of lowered levels of serotonin on γ-aminobutyric acid (GABA) in the synaptic cleft.

Maher and Wurtman (1987) suggested that aspartame consumption could cause neurological or behavioural reactions in some people. When mice were given aspartame in doses that raise plasma phenylalanine levels more than those of tyrosine (which probably occurs after any aspartame dose in humans), the frequency of seizures increased, especially following the administration of the epileptogenic drug, pentylenetetrazole. Equimolar concentrations of phenylalanine stimulate this effect and are blocked by synchronized administration of valine, which blocks phenylalanine's entry into the brain (Maher and Wurtman, 1987).
Glutamate, the most common neurotransmitter in the brain, is formed from its precursor α-ketoglutarate from the Kreb's cycle (Figure 5). Glutamate is primarily produced in neurons as excitatory neurotransmitters owing to an increased flow of positive ions (sodium and calcium) by opening the ion-channel after binding to appropriate receptors. Stimulation of these receptors is terminated by a chloride-independent membrane transport system, which is used only for reabsorbing glutamate and aspartate across the presynaptic membrane. Glutamate can also be reabsorbed into the neurons for later use. Excess glutamate released into the synapses is converted into glutamine (non-excitotoxic molecule) by nearby astrocytes (glial cells). Glutamine is safely transported back to neurons, for reconversion into glutamate. Swollen astrocytes contribute to the excitotoxicity of glutamate owing to their inability to absorb excess glutamate. Glutamate acts on its postsynaptic N-methyl-D-aspartate (NMDA) and non-NMDA receptors. The NMDA receptor is an ion channel for calcium, sodium and potassium ions. Glutamate and aspartate exert their action through three separate receptors characterized by selective interaction with NMDA, quisqualate and kainate (Hidemitsu et al., 1990). The glutamate recognition sites might directly be acted upon by aspartame in the brain synaptic membranes. This interaction might play a vital role in mediating the potentiation of hippocampal excitability as reported by Fountain et al. (1988).

Production pathway of glutamate and γ-aminobutyric acid (GABA) in neuronal and glial cells.
As discussed above, aspartame may act on the NMDA receptors, leading to continuous activation of these receptor sites resulting in no binding space for glutamate. Continuous activation might cause damage to brain neurons, as suggested by Choi and Rothman (1990). Thus, aspartame acts as an agonist of glutamate on the NMDA receptor (Fountain et al., 1988).
GABA is also primarily produced by neurons in the citric acid cycle from succinate and is inactivated by absorption into astrocytes (Figure 5). GABA is secondarily produced in astrocytes from glutamine. It can be released from the astrocytes as GABA or it can be reabsorbed into the neuron as glutamine (for conversion into either glutamate or GABA). If the neuroenergetics of the cells were compromised by the presence of aspartame, thus lowering glucose and oxidative metabolism, this important feedback system of tryptophan and tyrosine will be inhibited (Ganong, 1997).
Owing to a lowered level of oxidative metabolism and low glucose levels in the cells, pyruvate would not be converted into acetyl CoA necessary for production of acetylcholine in synapses (Figure 6). Thus, it could lead to a decreased stimulation of second messengers (often cyclic AMP) to indirectly open the ion channels. Since aspartame causes neurodegeneration (destructions of neurons), the neurons in the Meynert nucleus will also be decreased. The Meynert nucleus is the primary cholinergic input for the cerebral cortex, and loss of neurons in this nucleus has been shown in Alzheimer's patients. Thus, aspartame might be involved in the cause/mimic of Alzheimer's disease (Ganong, 1997; Bowen and Evangelista, 2002).

Production pathway of acetylcholine in neuronal cells.
Effects of aspartic acid
One of the largest studies commissioned by the aspartame manufactures are of the opinion that: ‘in most cases aspartate concentrations were not significantly affected by aspartame ingestion’ (Stegink et al., 1988; Stegink et al., 1989). If read in another way, it suggests that in some cases aspartic acid was, indeed, increased. Aspartic acid is thought to play a role as an excitatory neurotransmitter in the central nervous system (Watkins, 1984; Stone and Burton, 1988). Glutamate, asparagines and glutamine are formed from their precursor, aspartic acid (Stegink et al., 1989). Aspartate is inactivated by reabsorption into the presynaptic membrane and it opens an ion channel (Olney, 1975). Aspartate is an excitatory neurotransmitter and has an increased likelihood for depolarization of the postsynaptic membrane. Even short-lived increases of a powerful neural stimulator are enough to induce neuroendocrine disturbances (Olney, 1975). In addition, Mehl-Madrona (2005) observed that when the temperature of aspartame exceeds 86°F, the wood alcohol in aspartame is converted into formaldehyde and then to formic acid, which in turn causes metabolic acidosis. The methanol toxicity is thought to mimic the symptoms of multiple sclerosis. According to them, symptoms of fibromyalgia, spasms, shooting pains, numbness in the legs, cramps, vertigo, dizziness, headaches, tinnitus, joint pain, depression, anxiety, slurred speech, blurred vision or memory loss have been attributed to aspartame.
Effects of methanol
As mentioned previously, aspartame breaks down to form phenylalanine, aspartic acid and methanol, which form 10% of the break down product. The methanol in the body is converted to formate, which is then excreted. It can also give rise to formaldehyde, diketopiperazine (a carcinogen) and a number of other highly toxic derivatives (Clarke, 2000). The absorption-metabolism sequence of methanol → formaldehyde → formic acid also results in synergistic damage (Bowen and Evangelista, 2002). The accumulation of formate rather than methanol is itself considered to cause methanol toxicity (Stegink et al., 1989), but research has shown that formaldehyde adducts accumulate in the tissues, in both proteins and nucleic acids, after aspartame ingestion (Trocho et al., 1998). The formed adducts of the metabolic poisons alter both mitochondrial DNA and nucleic DNA. Methanol and formaldehyde are also known to be carcinogenic and mutagenic. The damaged DNA could cause the cell to function inadequately or have an unbalanced homoeostasis, thus initiating disease states (Bowen and Evangelista, 2002). In addition, it is thought that the methanol is the aspartame is converted to formaldehyde in the retina of the eye, causing blindness (Mehl-Madrona, 2005).
As seen from the above discussion, tryptophan, tyrosine and phenylalanine are precursors for the neurotransmitters serotonin, dopamine and norepinephrine. Glutamate (glutamic acid) and aspartate (aspartic acid), as neurotransmitters, have no direct access to the brain and have to be synthesized in the neuronal cells of the brain. Proteins rich in aspartate and glutamate have no effect on the levels of acidic amino acids in the brain. If aspartame is ingested in large amounts, it will increase the levels of acidic amino acids in the brain (Fernstrom, 1994).
Effects of aspartame on the blood brain barrier
A compromised BBB (altered lipid-mediated transport or active carrier transport) will result in the transport of excitotoxins (aspartame) across BBB and within the cerebrospinal fluid causing several adverse reactions to occur:
The nerves will be stimulated to fire excessively by the excitotoxins.
The offset of induced, repeated firing of the neurons mentioned above will require normal enzymes, which are negated by the phenylalanine and aspartic acid present in aspartame.
These compulsory enzyme reactions mentioned above require a normal functioning energy system. Thus, it could be stated that the neurons become compromised from (Bowen and Evangelista, 2002):
diminishing intracellular ATP stores;
the presence of formaldehyde;
intracellular calcium uptake been changed (e.g. phenylalanine binds to NMDA receptor, not glutamate, thus altering calcium channels);
cellular mitochondrial damage;
destruction of the cellular wall; and
subsequent release of free radicals.
These preceding reactions potentiate oxidative stress and neurodegeneration. Secondary damage is caused by the toxic by-products, which in turn will increase capillary permeability, continuing to destroy the surrounding nerve and glial cells, thus further obstructing enzyme reactions and promoting DNA structural defects. Cellular death occurs over the next 1–12 h (Bowen and Evangelista, 2002).
Excitotoxic-saturated placental blood flow, caused by maternal aspartame consumption, could lead to the damage or impairment of the development of the foetal nervous system, contributing to cerebral palsy and all-encompassing developmental disorders (Bowen and Evangelista, 2002). Mehl-Madrona (2005) also cited findings implicating aspartame consumption at the time of conception to consequent birth defects, because the phenylalanine concentrates in the placenta, causing mental retardation. Laboratory tests showed that animals developed brain tumours as a result of aspartame administration. It was also pointed out that phenylalanine breaks down into 1-deoxy-D-xylulose-5-phosphate (DXP), a brain tumour agent. In keeping with these findings, neuronal (brain) damage is also produced by excitotoxins circulating in the fetal brain areas, as a result of an incompetent BBB. This is especially true for those areas adjacent to the brain's ventricular system. The methanol components of aspartame are thought to mimic fetal alcohol syndrome, which is a direct result of the maternal ingestion of aspartame (Bowen and Evangelista, 2002).
The amino acids that constitute meat contain a chain of 80–300 amino acids, of which 4% are phenylalanine. This chain also includes the amino acid valine. Valine inhibits the transport of phenylalanine into the brain across the BBB. In aspartame, phenylalanine makes up 50% of the molecule; thus, in a can of diet soda, which contains 200 mg aspartame, 100 mg is phenylalanine. No valine is present in aspartame to block the entry of toxic levels of phenylalanine into the brain, thus resulting in lowered concentrations of dopamine and serotonin owing to NAAT occupation by phenylalanine.
Thus, it can be concluded that the usage of aspartame should be carefully considered as it (and its metabolites) causes detrimental effects, ranging from alterations in concentrations of neurotransmitters to causing infertility. Thus, human health at the macroscopic, microscopic and cellular level is at risk of being destroyed.
Comparison between human and animal reaction to aspartame
Physiologically, the animals tested for phenylalanine toxicity are approximately 60 times less sensitive than human beings. Humans are 10–20 times more sensitive to methanol poisoning both as a subchronic and chronic toxin/carcinogen. The differences in enzyme concentrations of the species suggest that animals studied are more sensitive to the more common ethanol found in alcoholic beverages. Test animals being used are 8–10 times less sensitive than humans to the effects of aspartic acid and glutamates (Bowen and Evangelista, 2002).
Implications of aspartame consumption for early brain development and everyday living
Ingestion of aspartame results in a craving for carbohydrates, which will eventually result in weight gain, especially because the formaldehyde stores in the fat cells, particularly in the hips and thighs; therefore, aspartame is believed to cause problem in diabetic control. (Mehl-Madrona, 2005). In addition, prenatal consumption of aspartame might result in mental retardation, impaired vision, birth defects and is thought to play a role in the pathogenesis of Alzheimer's disease; furthermore, it is implicated in disruption of learning and emotional functioning due to its involvement in alteration of certain neurotransmitters. The earlier research findings show that aspartame consumption might affect early brain development and neurotransmitter systems, which might result in specific emotional, behavioural and learning difficulties as discussed below.
Dopamine involvement in emotional status and learning
In the preceding sections it was noted that when phenylalanine, one of the main component of aspartame, competes with tyrosine for NAAT, a compromised dopamine production will result, because phenylalanine will bind more frequently and freely than tyrosine owing to its higher concentration. This will thus lead to lower concentrations of dopamine in the brain. Dopamine receptors are numbered D1, D2, D3, D4 and D5 receptors, all playing an important role in the dopaminergic system. The dopaminergic system is active in maintaining normal motor behaviour, and loss of dopamine is related to Parkinson's disease, in which the muscles are rigid and movement is difficult (Kolb and Whishaw, 2003). Disturbances of the development of the dopaminergic system may lead to dyskinesia, dystonia, tics, obsessive–compulsive disorders and abnormal eye movements (Herlenius and Langercrantz, 2004). This has been observed in DA-depleted rats after 6-hydroxyl dopamine treatment but with preserved noradrenaline effect (Zhou and Palmiter, 1995). D1-receptors are involved in working memory performance (Williams and Goldman-Rakic (1995)). A disturbance of the development of the dopaminergic system has been postulated to contribute to the cause of attention deficit hyperactivity disorder (ADHD) in which a deficient working memory is an important component (Dare et al., 2003). In 2002, Bowen and Evangelista noted a substantial increase in levels of plasma phenylalanine and aspartic acid after ingestion of aspartame. This increased phenylalanine causes PKU effect as noted earlier in this study. Infants with phenylketonuria and probably deficient dopaminergic innervation of the prefrontal cortex have been found to have (among other symptoms) an impaired working memory (Diamond et al., 2004).
Serotonin involvement in early brain development, emotional status and learning
Tryptophan, independently utilized for synthesis of serotonin in the brain, is transported across the BBB via NAAT. Therefore, if NAAT is saturated with phenylalanine, tryptophan will not be adequately carried over the BBB and serotonin production can ultimately be compromised. In addition to its role in regulating maturation of terminal areas, serotonin can set its own terminal density—a phenomenon Whitaker-Azmitia (2001) termed autoregulation of development.
Serotonin (5-HT), like other monoamine neurotransmitters, has been shown to play a role in regulating brain development before the time it assumes its role as a neurotransmitter in the mature brain (Chubakov et al., 1986, 1993; Lauder, 1990; Whitaker-Azmitia, 1991; Turlejski, 1996; Whitaker-Azmitia et al., 1996). This neurotransmitter is concentrated in the raphe nucleus of the brain, and is also present in platelets. Serotonin and serotonergic neurons are localized in the midbrain, the pineal gland, the substantia nigra, the hypothalamus and the raphe nuclei of the brain stem (Herlenius and Lagercrantz, 2004). The 5-HT neurons have widespread projections, making it possible to coordinate complex sensory and motor behavioural conditions. Serotonin is also involved in inducing sleep, sensory perception, temperature regulation and control of mood; therefore, serotoninergic activity was found to be highest during waking and arousal and absent during active or rapid eye-movement sleep (Boutrel et al, 1999).
In addition, serotonin has been reported to affect neuronal proliferation, differentiation, migration and synaptogenesis (Gaspar et al., 2003). In the mammalian brain, all the monoamine neurotransmitter systems are present relatively early but, in particular, serotonin is likely to present the earliest in the most terminal regions (Whitaker-Azmitia, 2001). These early appearances of serotonergic neurons with their wide distribution of terminals play a crucial role in programmed neurogenesis, synaptogenesis and apoptosis. Serotonergic cells in the raphne are among the earliest to be generated in the brain (Gaspar et al., 2003). Therefore, serotonin concentration must be neither too high nor too low during the critical period of synaptogenesis and formation of cortical connections. Serotonergic abnormalities are also associated with abnormalities of cortical development and thalamocortical connectivity, as abnormal serotonin transport or synthesis during brain development may directly affect formation of intracortical and thalamocortical circuitry (Chugani, 2004). Furthermore, disruptions of the serotonergic pathways due to excess or inadequate activation of specific 5-HT receptors during development are implicated in the pathogenesis of developmental disorders such as autism (Gaspar et al., 2003). The relative balance of tryptophan metabolism, regulated by the serotonin and kynurenine pathways, might therefore be important in the pathogenesis of pervasive developmental disorders among children, and aspartame consumption may therefore play a role in the occurrence of developmental disorders.
GABA involvement in early brain development, emotional status and learning
The removal of the carboyxl (COOH) group from glutamate produces GABA, which is the main inhibitory transmitter (Kolb and Whishaw, 2003), and perhaps 25–40% of all nerve terminals contain GABA (Herlenius and Lagercrantz, 2004). In humans, the majority of neocortical GABAergic neurons arise locally in the ventricular and subventricular zone. Proportionally fewer GABAergic neurons originate from the ganglionic eminence of the ventral forebrain (Letinic et al., 2002). The lowered levels of serotonin due to aspartame consumption might cause lowered activity of the GABA transporters, and thus GABA is absorbed at a lower rate into the astrocytes, which will result in the continuous inhibition of depolarization of the postsynaptic membrane.
Although GABA is regarded as the main inhibitory transmitter in the mature animal, it has a different role during early development (Herlenius and Lagercrantz, 2004). During early brain development, it acts as a trophic factor to influence events such as proliferation, migration, differentiation, synapse maturation and cell death (Owens and Kriegstein, 2002). Herlenius and Lagercrantz (2004) report that GABA is a crucial transmitter for the human infant and operates mainly as an excitatory transmitter on immature neurons. As GABA has a trophic role during early brain development, interference with the function of GABAergic transmission during this period may affect the development of neuronal wiring, plasticity of neuronal network and also have a profound influence on neural organization (Herlenius and Lagercrantz, 2004).
Acetylcholine involvement in early brain development, emotional status and learning
Previously, it was mentioned that aspartame could cause changes to acetylcholine production. It is known that at a lowered level of oxidative metabolism and low glucose levels in the cells, pyruvate would not be converted into acetyl CoA necessary for production of acetylcholine in synapses. Acetylcholine is one of the major neurotransmitters of importance in the brain for cortical activation, attention, reward and pain. The cholinergic system is thought to play a role in memory and learning by maintaining neuron excitability. Death of acetylcholine neurons and decrease in acetylcholine in the neocortex are thought to be related to Alzheimer's disease (Kolb and Whishaw, 2003), as it has a major role in the control motor tone and movement and probably counterbalances the effect of dopamine (Johnston and Silverstein, 1998; Cooper et al., 2003). In addition, acetylcholine is of major importance for the development and the control of autonomic functions, and alterations to the cholinergic system might result in major changes in cortical structure. These changes can be correlated to cognitive deficits but do not affect motor behaviour (Herlenius and Lagercrantz, 2004).
Norepinephrine involvement in emotional status and learning
Aspartame may also cause a change in norepinephrine. Compared with dopamine systems, which restrict their outputs to the reptilian brain (that is, the basal ganglia) and frontal cortex, the projections of the caudally situated noradrenaline systems are more widespread. The cell bodies of the noradrenergic neurons are concentrated in the brain stem, particularly in the locus coeruleus within the caudal pons (Kolb and Whishaw, 2003). Five major noradrenergic tracts originate from the locus coeruleus that disperse through the whole brain. There are also clusters of noradrenergic cell bodies in the nucleus tractus solitarius and in the lateral ventral tegmental field (Herlenius and Lagercrantz, 2004). Fibres from these nuclei intermingle with those from the locus coeruleus. The A6 noradrenaline cell group, well known as the locus coeruleus, controls higher brain activity through the dorsal noradrenaline pathway. This group sends inputs to the cortex, hypothalamus, cerebellum, lower brain stem and spinal cord, thereby exerting control over cortical arousal and attention, fear and anxiety, and learning and memory. The ventral noradrenaline pathway infiltrates the hypothalamus and the limbic system (Panksepp, 1998).
Noradrenergic neurons appear at an early stage in the development of the central nervous system. Sundstrom et al (1993) reported noradrenergic neuronal development at the 12th to 14th day of gestation in the rat and within 5-6 weeks in the human, and Sundstrom (1996) later suggested that noradrenaline is essential for normal brain development. In addition, the noradrenergic system regulates the development of the Cajal-Retzius cells that are the first neurons to be formed in the cortex (Herlenius and Lagercrantz, 2004). Wang and Lidow (1997) showed that radial glia participate in key steps of brain development and cortical neurogenesis, whereas two independent studies showed glia participation in migration (Noctor et al., 2001, 2004). Thus, adrenergic transmission may be involved in regulating the generation, migration and maturation of cerebral cortical cells. Herlenius and Lagercrantz (2004) reported that administration of 6-OH-dopamine prevents programmed cell death of these neurons and delays the formation of cortical layers. Lesioning of the noradrenergic projections or blocking of neurotransmission with receptor antagonist prevents astrogliosis and glial cell proliferation.
During postnatal development, noradrenaline plays an important role in regulating attention, as noradrenergic cells are exquisitely sensitive to environmental stimuli, especially powerful emotional events (Panksepp, 1998). With low noradrenaline activity, individuals tend to perseverate on a task despite changes in stimulus contingencies because of attention deficits. Such individuals are prone to act impulsively rather than deliberately. Depletion of noradrenaline during the perinatal period can also result in subtle dendritic changes and possibly also alterations in cortical differentiation that may lead to behavioural changes (Berger-Sweeney and Hohmann, 1997). It is also known that noradrenaline dampens the background ‘noise’ or cortical neural activity irrelevant to a given task (Panksepp, 1998). This makes the influence of specific incoming signals more prominent in the cortex, namely the ratio of the signal to background noise is increased. Thus, it is suspected that with high noradrenaline activity, individuals can better process information that already has access to the cortex.
Glutamate involvement in emotional status and learning
The glutamate recognition sites might directly be acted upon by aspartame in the brain synaptic membranes, and aspartame may act on the NMDA receptors, leading to continuous activation of these receptor sites and no binding space for glutamate. The excitatory amino acid transmitter glutamate and the inhibitory amino acid transmitter GABA are closely related in the sense that GABA is formed by a simple modification of glutamate (Herlenius and Lagercrantz, 2004). Glutamate is widely distributed in the forebrain and cerebellum and also in neurons, but it becomes a neurotransmitter only if it is appropriately packed in vesicles in the axon terminal (Kolb and Whishaw, 2003). Glutamate acts on at least five types of receptors, and particularly the NMDA receptors dominate in the immature brain when synaptic transmission is weak and extremely plastic, as the NMDA receptors permit entry of Na+ and Ca2+ when opened. NMDA channels seem to be crucially involved in the appearance of long-term potentiation and synaptic plasticity underlying learning and memory storage throughout life (Herlenius and Lagercrantz, 2004). Cell death resulting from glutamate occurs in two ways: first, it causes an increase in intracellular calcium that poisons the cell, and second, the increase in intracellular calcium can activate genes in the cell's DNA to produce proteins that kill the cell, called apoptosis (Kolb and Whishaw, 2003). During critical periods of development and synaptogenesis, NMDA receptors play an essential role in activity-dependent plasticity and synaptic refinement (McDonald and Johnston, 1990; Qu et al., 2003). Thus, either too much or too little NMDA receptor activity can be life-threatening to developing neurons (Lipton and Nakanishi, 1999).
Conclusion
It was seen that aspartame disturbs amino acid metabolism, protein structure and metabolism, integrity of nucleic acids, neuronal function, endocrine balances and changes in the brain concentrations of catecholamines. It was also reported that aspartame and its breakdown products cause nerves to fire excessively, which indirectly causes a very high rate of neuron depolarization. The energy systems for certain required enzyme reactions become compromised, thus indirectly leading to the inability of enzymes to function optimally. The ATP stores in the cells are depleted, indicating that low concentrations of glucose are present in the cells, and this in turn will indirectly decrease the synthesis of acetylcholine, glutamate and GABA. The intracellular calcium uptake has been altered, thus the functioning of glutamate as an excitatory neurotransmitter is inhibited. Mitochondria are damaged, which could lead to apoptosis of cells and infertility in men and also a lowered rate of oxidative metabolism are present, thus lowering concentrations of the transmitters glutamate and production of GABA. The cellular walls are destroyed; thus, the cells (endothelium of the capillaries) are more permeable, leading to a compromised BBB. Thus, overall oxidative stress and neurodegeneration are present.
From all the adverse effects caused by this product, it is suggested that serious further testing and research be undertaken to eliminate any and all controversies surrounding this product.
https://www.nature.com/articles/1602866
https://www.ncbi.nlm.nih.gov/pmc/articles/PMC6080735/
17 Things That Happen to Your Body When You Drink Soda

Well, one-third of Americans actually report having at least one sugar-sweetened beverage every day, according to the CDC. It's no surprise that one-third of adults are also considered to be obese.
Even if you're not a regular soda drinker, you may think the occasional splurge is harmless. But the combination of sugar, chemicals, and carbonation required to make your favorite fizzy beverage can wreak havoc on more than just your waistline.
Here's what drinking soda really does to your body.
One of the most obvious side effects of drinking soda is the risk of weight gain, thanks to the influx of calories and sugar. A 12-ounce can of soda contains around 150 calories and up to 40 grams of sugar. Drinking one a day means ingesting more than 130,000 extra calories a year, or 15 pounds of added fat! But it's more than just the extra calories per soft drink that's packing on the pounds; soda has been found to lead to uniquely weight gain. A study in The American Journal of Clinical Nutrition found that drinks containing high-fructose corn syrup (which is in a lot of sodas) are linked to obesity. Fructose is absorbed in the body differently than other sugars, the study assesses, which affects insulin levels and metabolism, and can lead to weight gain.
Even Diet Soda Causes Weight Gain
And it's not just the full-calorie options; diet soda can also cause people to pack on the pounds, according to a 2015 study published in the Journal of the American Geriatrics Society. The study showed that over nine years, people who drank diet soda gained almost three times as much belly fat as those who didn't drink diet soda. Researchers have theorized that the consumption of artificial sweeteners leads to more sugar cravings, and therefore causes people to eat more calories than they normally would.
Drinking soda causes your blood sugar to spike, and it sends your pancreas into overdrive producing insulin to metabolize all that sugar. So it's no surprise a study in the American Heart Association journal Circulation found that consuming sugar-sweetened beverages, like soda, was linked to the onset of type 2 diabetes. And this correlation was independent of obesity's impact on developing type 2 diabetes. The researchers of the study recommended a decrease in sugar-sweetened beverage consumption, and we couldn't agree more.
It makes sense, but it's worth noting: drinking sugar-sweetened beverages will increase your risk of diabetes as well as your risk of prediabetes. Prediabetes is a condition where your blood sugar levels are higher than normal, but are not at the levels found in diabetics. When Tufts University researchers examined the dietary habits of Americans, they found that those who consumed roughly six 12-ounce cans of soda a week had a 46 percent higher risk of developing prediabetes compared to those who drank less soda as well as those who drank no soda at all over the course of 14 years. Since 25 percent of prediabetics will develop type 2 diabetes over a 5-year time period, the fact that sipping on soda increases your risk of prediabetics is just as scary as its effect on diabetes risk.
Your Body Ages Prematurely
Sure, the weight gain and cancer risk from soda may age you, but drinking it affects your body on a cellular level. Researchers from the University of California, San Francisco found that people who drank more sugar-sweetened beverages had shorter ends of their chromosomes, known as telomeres. When telomeres are shorter, cells can't regenerate as quickly, meaning a more rapid aging of the body. This can lead to diseases such as heart disease, diabetes, and some types of cancer, and (unsurprisingly) a shorter lifespan—a steep price to pay for a regular soda habit.
Can soft drinks speed aging?
Drinking 8 ounces of sweetened soda daily inflicts 1.9 extra years of aging on your cells, a new study concludes
Losing control over sugar
A common pollutant and sweetener mess with important hormones
Inside your body, sugar goes hand-in-hand with a substance called insulin. A type of hormone, insulin regulates the activity of cells and tissues. It calls the shots after you devour that delicious donut, helping organs pluck a type of sugar called glucose from the bloodstream. When insulin is missing or doesn’t do its job, sugar accumulates in the blood instead of getting into and feeding cells. This throws the body’s balance out of whack, causing a disease called diabetes.
An organ called the pancreas, near the beginning of the large intestine, produces insulin. The more glucose that tickles the pancreas, the more insulin it produces to process the sugar. But new studies show that other things can also cause the pancreas to release insulin. In one study, a sugar called fructose boosted insulin levels; in another, a common pollutant called bisphenol A (BPA) caused the same reaction.

Fructose gives fruit, honey and high-fructose corn syrup their sweetness. Nutritionists — backed by scientific studies — say we eat too much high-fructose corn syrup, found in foods from soft drinks to salad dressing. Scientists working on one of the new studies used human cells, mouse cells and live mice to study what happens when fructose meets the pancreas.
The team found that cells in the pancreas can “taste” the fructose, in a process similar to how the tongue tastes sugar. The study, like many other recent discoveries, shows that taste buds can occur — and taste chemicals — far from the tongue. Fructose alone didn’t boost insulin levels. But in the study, when glucose and fructose appeared together, the pancreas produced more insulin than it did when it encountered glucose alone.
“The system seems to be elegantly made to keep a balance,” Björn Tyrberg told Science News. Tyrberg, who led the new work, studies the biology of cells at Sanford-Burnham Medical Research Institute in Orlando, Fla.
The body may have a hard time keeping that balance in the presence of BPA, too. This chemical, commonly found in plastics and cash register receipts, can imitate a hormone called estrogen. One of estrogen’s jobs is to keep track of insulin, telling the pancreas to produce more if it is needed.
In the second new study, scientists found that BPA, like estrogen, can trigger insulin production. But because BPA is a pollutant, it stimulates the pancreas to create insulin when it’s not needed. The researchers also demonstrated that it doesn’t take much BPA to get the pancreas to pump out extra insulin. BPA and fructose may be radically different compounds, but both can throw off the body’s balance in similar ways.
Angel Nadal of Miguel Hernández University in Elche, Spain, led the BPA study. He told Science News that extra insulin in the blood may cause other tissues to start ignoring this important hormone. Called “insulin resistance,” this condition can lead to the buildup of glucose in the blood indicative of type 2 diabetes. In experiments by Nadal and his colleagues, animals exposed to BPA ended up with insulin resistance more often than other animals did. Nadal thinks that BPA in the body may speed up the onset of type 2 diabetes in people with a family history of the disease.
Franck Mauvais-Jarvis of Northwestern University’s Feinberg School of Medicine in Chicago told Science News that he doesn’t think BPA alone can cause diabetes. Lots of different chemicals can throw off the body’s balance. He says, “I suspect it’s a cocktail of these nasties” that can make a person more likely to develop the disease.
POWER WORDS (adapted from the New Oxford American Dictionary)
pancreas A large gland located behind the stomach. It secretes digestive enzymes (proteins that stimulate or speed up chemical reactions) into the intestines. It also secretes the hormone insulin into the blood.
insulin A hormone produced in the pancreas. It regulates the amount of glucose in the blood. A lack of insulin or a loss in the body’s responsiveness to it can both cause diabetes.
fructose A simple sugar found in honey and fruit and the sugar that makes up half of each molecule of sucrose, or table sugar.
glucose A simple sugar that is an important energy source in living organisms and a component of many carbohydrates. It also makes up half of each molecule of sucrose, or table sugar.
hormone A regulatory substance produced in an organism and transported in tissue fluids such as blood to stimulate the activity of specific cells or tissues.
https://www.healthline.com/nutrition/sucrose-glucose-fructose
Sucrose vs Glucose vs Fructose: What's the Difference?
If you’re trying to cut back on sugar, you may wonder whether the type of sugar matters.
Sucrose, glucose and fructose are three types of sugar that contain the same number of calories gram for gram.
They’re all found naturally in fruits, vegetables, dairy products and grains but also added to many processed foods.
However, they differ in their chemical structures, the way your body digests and metabolizes them and how they affect your health.
This article examines the main differences between sucrose, glucose and fructose and why they matter.

Sucrose is the scientific name for table sugar.
Sugars are categorized as monosaccharides or disaccharides.
Disaccharides are made up of two, linked monosaccharides and broken back down into the latter during digestion (
Sucrose is a disaccharide consisting of one glucose and one fructose molecule, or 50% glucose and 50% fructose.
It’s a naturally occurring carbohydrate found in many fruits, vegetables and grains, but it’s also added to many processed foods, such as candy, ice cream, breakfast cereals, canned foods, soda and other sweetened beverages.
Table sugar and the sucrose found in processed foods are commonly extracted from sugar cane or sugar beets.
Sucrose tastes less sweet than fructose but sweeter than glucose (
Glucose
Glucose is a simple sugar or monosaccharide. It’s your body’s preferred carb-based energy source (
Monosaccharides are made up of one single unit of sugar and thus cannot be broken down into simpler compounds.
They’re the building blocks of carbohydrates.
In foods, glucose is most commonly bound to another simple sugar to form either polysaccharide starches or disaccharides, such as sucrose and lactose (
It’s often added to processed foods in the form of dextrose, which is extracted from cornstarch.
Glucose is less sweet than fructose and sucrose (
Fructose
Fructose, or “fruit sugar,” is a monosaccharide like glucose (
It’s naturally found in fruit, honey, agave and most root vegetables. Moreover, it’s commonly added to processed foods in the form of high-fructose corn syrup.
Fructose is sourced from sugar cane, sugar beets and corn. High-fructose corn syrup is made from cornstarch and contains more fructose than glucose, compared to regular corn syrup (
Of the three sugars, fructose has the sweetest taste but least impact on your blood sugar (
SUMMARYSucrose is made up of the simple sugars glucose and fructose. Sucrose, glucose and fructose are found naturally in many foods but also added to processed products.
Your body digests and absorbs monosaccharides and disaccharides differently.
Since monosaccharides are already in their simplest form, they don’t need to be broken down before your body can use them. They’re absorbed directly into your bloodstream, primarily in your small intestine (
On the other hand, disaccharides like sucrose must be broken down into simple sugars before they can be absorbed.
Once the sugars are in their simplest form, they’re metabolized differently.
Glucose Absorption and Use
Glucose is absorbed directly across the lining of the small intestine into your bloodstream, which delivers it to your cells (
It raises blood sugar more quickly than other sugars, which stimulates the release of insulin (
Insulin is needed for glucose to enter your cells (
Once inside your cells, glucose is either used immediately to create energy or turned into glycogen to be stored in your muscles or liver for future use (
Your body tightly controls your blood sugar levels. When they get too low, glycogen is broken down into glucose and released into your blood to be used for energy (
If glucose is unavailable, your liver can make this type of sugar from other fuel sources (
Fructose Absorption and Use
Like glucose, fructose is absorbed directly into your bloodstream from the small intestine (
It raises blood sugar levels more gradually than glucose and does not appear to immediately impact insulin levels (
However, even though fructose doesn’t raise your blood sugar right away, it may have more long-term negative effects.
Your liver has to convert fructose into glucose before your body can use it for energy.
Eating large amounts of fructose on a high-calorie diet can raise blood triglyceride levels (
Excessive fructose intake may also raise the risk of metabolic syndrome and non-alcoholic fatty liver disease (
Sucrose Absorption and Use
Since sucrose is a disaccharide, it must be broken down before your body can use it.
Enzymes in your mouth partially break down sucrose into glucose and fructose. However, the majority of sugar digestion happens in the small intestine (
The enzyme sucrase, which is made by the lining of your small intestine, splits sucrose into glucose and fructose. They are then absorbed into your bloodstream as described above (
The presence of glucose increases the amount of fructose that is absorbed and also stimulates the release of insulin. This means that more fructose is used to create fat, compared to when this type of sugar is eaten alone (
Therefore, eating fructose and glucose together may harm your health more than eating them separately. This may explain why added sugars like high-fructose corn syrup are linked to various health issues.
SUMMARYGlucose and fructose are absorbed directly into your bloodstream, while sucrose must be broken down first. Glucose is used for energy or stored as glycogen. Fructose is converted to glucose or stored as fat.
Your body converts fructose to glucose in the liver to use it for energy. Excess fructose places a burden on your liver, which may lead to a series of metabolic problems (
Several studies have demonstrated the harmful effects of high fructose consumption. These include insulin resistance, type 2 diabetes, obesity, fatty liver disease and metabolic syndrome (
In one 10-week study, people who drank fructose-sweetened beverages had an 8.6% increase in belly fat, compared to 4.8% in those who drank glucose-sweetened drinks (
Another study found that while all added sugars can increase your risk of type 2 diabetes and obesity, fructose may be the most harmful (
What’s more, fructose has been shown to increase the hunger hormone ghrelin and may make you feel less full after eating (
Since fructose is metabolized in your liver like alcohol, some evidence suggests that it may be similarly addictive. One study found that it activates the reward pathway in your brain, which may lead to increased sugar cravings (20,
SUMMARYFructose has been linked to several negative health effects, including obesity, type 2 diabetes, insulin resistance and fatty liver disease. Consuming fructose may also increase feelings of hunger and sugar cravings.
There is no need to avoid sugars that are naturally found in whole foods, such as fruits, vegetables and dairy products. These foods also contain nutrients, fiber and water, which counter any of their negative effects.
The harmful health effects associated with sugar consumption are due to the high amount of added sugar in the typical Western diet.
A survey of over 15,000 Americans found that the average person consumed 82 grams of added sugars per day, or approximately 16% of their total calories — far more than the daily recommendation (
The World Health Organization recommends limiting added sugars to 5–10% of your daily calorie consumption. In other words, if you’re eating 2,000 calories per day, keep added sugars to less than 25–50 grams (23).
To put that into perspective, one 12-ounce (355 ml) can of soda contains about 30 grams of added sugar, which is enough to push you over your daily limit (24).
What’s more, sugars are not only added to foods that are obviously sweet like sodas, ice cream and candy, but also to foods you wouldn’t necessarily expect, such as condiments, sauces and frozen foods.
When buying processed foods, always read the ingredient list carefully to look for hidden sugars. Keep in mind that sugar can be listed by over 50 different names.
The most effective way to reduce your sugar intake is to eat mostly whole and unprocessed foods.
SUMMARYAdded sugars should be limited, but there is no need to worry about those found naturally in foods. Consuming a diet high in whole foods and low in processed foods is the best way to avoid added sugars.
Glucose and fructose are simple sugars or monosaccharides.
Your body can absorb them more easily than the disaccharide sucrose, which must be broken down first.
Fructose may have the most negative health effects, but experts agree that you should limit your intake of added sugar, regardless of the type.
However, there is no need to limit the sugars found naturally in fruits and vegetables.
To ensure a healthy diet, eat whole foods whenever possible and save added sugars for the occasional special treat.
https://www.healthline.com/nutrition/too-much-sugar#TOC_TITLE_HDR_14
11 Reasons Why Too Much Sugar Is Bad for You
From marinara sauce to peanut butter, added sugar can be found in even the most unexpected products.
Many people rely on quick, processed foods for meals and snacks. Since these products often contain added sugar, it makes up a large proportion of their daily calorie intake.
In the US, added sugars account for up to 17% of the total calorie intake of adults and up to 14% for children (
Dietary guidelines suggest limiting calories from added sugar to less than 10% per day (
Experts believe that sugar consumption is a major cause of obesity and many chronic diseases, such as type 2 diabetes.
Here are 11 reasons why eating too much sugar is bad for your health.

Rates of obesity are rising worldwide and added sugar, especially from sugar-sweetened beverages, is thought to be one of the main culprits.
Sugar-sweetened drinks like sodas, juices and sweet teas are loaded with fructose, a type of simple sugar.
Consuming fructose increases your hunger and desire for food more than glucose, the main type of sugar found in starchy foods (
Additionally, excessive fructose consumption may cause resistance to leptin, an important hormone that regulates hunger and tells your body to stop eating (
In other words, sugary beverages don’t curb your hunger, making it easy to quickly consume a high number of liquid calories. This can lead to weight gain.
Research has consistently shown that people who drink sugary beverages, such as soda and juice, weigh more than people who don’t (
Also, drinking a lot of sugar-sweetened beverages is linked to an increased amount of visceral fat, a kind of deep belly fat associated with conditions like diabetes and heart disease (
SUMMARYConsuming too much added sugar, especially from sugary beverages, increases your risk of weight gain and can lead to visceral fat accumulation.
High-sugar diets have been associated with an increased risk of many diseases, including heart disease, the number one cause of death worldwide (
Evidence suggests that high-sugar diets can lead to obesity, inflammation and high triglyceride, blood sugar and blood pressure levels — all risk factors for heart disease (
Additionally, consuming too much sugar, especially from sugar-sweetened drinks, has been linked to atherosclerosis, a disease characterized by fatty, artery-clogging deposits (
A study in over 30,000 people found that those who consumed 17–21% of calories from added sugar had a 38% greater risk of dying from heart disease, compared to those consuming only 8% of calories from added sugar (
Just one 16-ounce (473-ml) can of soda contains 52 grams of sugar, which equates to more than 10% of your daily calorie consumption, based on a 2,000-calorie diet (11).
This means that one sugary drink a day can already put you over the recommended daily limit for added sugar.
SUMMARYConsuming too much added sugar increases heart disease risk factors such as obesity, high blood pressure and inflammation. High-sugar diets have been linked to an increased risk of dying from heart disease.
A diet high in refined carbs, including sugary foods and drinks, has been associated with a higher risk of developing acne.
Foods with a high glycemic index, such as processed sweets, raise your blood sugar more rapidly than foods with a lower glycemic index.
Sugary foods quickly spike blood sugar and insulin levels, causing increased androgen secretion, oil production and inflammation, all of which play a role in acne development (
Studies have shown that low-glycemic diets are associated with a reduced acne risk, while high-glycemic diets are linked to a greater risk (
For example, a study in 2,300 teens demonstrated that those who frequently consumed added sugar had a 30% greater risk of developing acne (
Also, many population studies have shown that rural communities that consume traditional, non-processed foods have almost non-existent rates of acne, compared to more urban, high-income areas (
These findings coincide with the theory that diets high in processed, sugar-laden foods contribute to the development of acne.
SUMMARYHigh-sugar diets can increase androgen secretion, oil production and inflammation, all of which can raise your risk of developing acne.
The worldwide prevalence of diabetes has more than doubled over the past 30 years (
Though there are many reasons for this, there is a clear link between excessive sugar consumption and diabetes risk.
Obesity, which is often caused by consuming too much sugar, is considered the strongest risk factor for diabetes (
What’s more, prolonged high-sugar consumption drives resistance to insulin, a hormone produced by the pancreas that regulates blood sugar levels.
Insulin resistance causes blood sugar levels to rise and strongly increases your risk of diabetes.
A population study comprising over 175 countries found that the risk of developing diabetes grew by 1.1% for every 150 calories of sugar, or about one can of soda, consumed per day (
Other studies have also shown that people who drink sugar-sweetened beverages, including fruit juice, are more likely to develop diabetes (
SUMMARYA high-sugar diet may lead to obesity and insulin resistance, both of which are risk factors for type 2 diabetes.
Eating excessive amounts of sugar may increase your risk of developing certain cancers.
First, a diet rich in sugary foods and beverages can lead to obesity, which significantly raises your risk of cancer (
Furthermore, diets high in sugar increase inflammation in your body and may cause insulin resistance, both of which increase cancer risk (
A study in over 430,000 people found that added sugar consumption was positively associated with an increased risk of esophageal cancer, pleural cancer and cancer of the small intestine (
Another study showed that women who consumed sweet buns and cookies more than three times per week were 1.42 times more likely to develop endometrial cancer than women who consumed these foods less than 0.5 times per week (
Research on the link between added sugar intake and cancer is ongoing, and more studies are needed to fully understand this complex relationship.
SUMMARYToo much sugar can lead to obesity, insulin resistance and inflammation, all of which are risk factors for cancer.
While a healthy diet can help improve your mood, a diet high in added sugar and processed foods may increase your chances of developing depression.
Consuming a lot of processed foods, including high-sugar products such as cakes and sugary drinks, has been associated with a higher risk of depression (
Researchers believe that blood sugar swings, neurotransmitter dysregulation and inflammation may all be reasons for sugar’s detrimental impact on mental health (
A study following 8,000 people for 22 years showed that men who consumed 67 grams or more of sugar per day were 23% more likely to develop depression than men who ate less than 40 grams per day (
Another study in over 69,000 women demonstrated that those with the highest intakes of added sugars had a significantly greater risk of depression, compared to those with the lowest intakes (
SUMMARYA diet rich in added sugar and processed foods may increase depression risk in both men and women.
Wrinkles are a natural sign of aging. They appear eventually, regardless of your health.
However, poor food choices can worsen wrinkles and speed the skin aging process.
Advanced glycation end products (AGEs) are compounds formed by reactions between sugar and protein in your body. They are suspected to play a key role in skin aging (
Consuming a diet high in refined carbs and sugar leads to the production of AGEs, which may cause your skin to age prematurely (
AGEs damage collagen and elastin, which are proteins that help the skin stretch and keep its youthful appearance.
When collagen and elastin become damaged, the skin loses its firmness and begins to sag.
In one study, women who consumed more carbs, including added sugars, had a more wrinkled appearance than women on a high-protein, lower-carb diet (
The researchers concluded that a lower intake of carbs was associated with better skin-aging appearance (
SUMMARYSugary foods can increase the production of AGEs, which can accelerate skin aging and wrinkle formation.
Telomeres are structures found at the end of chromosomes, which are molecules that hold part or all of your genetic information.
Telomeres act as protective caps, preventing chromosomes from deteriorating or fusing together.
As you grow older, telomeres naturally shorten, which causes cells to age and malfunction (
Although the shortening of telomeres is a normal part of aging, unhealthy lifestyle choices can speed up the process.
Consuming high amounts of sugar has been shown to accelerate telomere shortening, which increases cellular aging (
A study in 5,309 adults showed that regularly drinking sugar-sweetened beverages was associated with shorter telomere length and premature cellular aging (
In fact, each daily 20-ounce (591-ml) serving of sugar-sweetened soda equated to 4.6 additional years of aging, independent of other variables (
SUMMARYEating too much sugar can accelerate the shortening of telomeres, which increases cellular aging.
Foods high in added sugar quickly spike blood sugar and insulin levels, leading to increased energy.
However, this rise in energy levels is fleeting.
Products that are loaded with sugar but lacking in protein, fiber or fat lead to a brief energy boost that’s quickly followed by a sharp drop in blood sugar, often referred to as a crash (
Having constant blood sugar swings can lead to major fluctuations in energy levels (
To avoid this energy-draining cycle, choose carb sources that are low in added sugar and rich in fiber.
Pairing carbs with protein or fat is another great way to keep your blood sugar and energy levels stable.
For example, eating an apple along with a small handful of almonds is an excellent snack for prolonged, consistent energy levels.
SUMMARYHigh-sugar foods can negatively impact your energy levels by causing a spike in blood sugar followed by a crash.
A high intake of fructose has been consistently linked to an increased risk of fatty liver.
Unlike glucose and other types of sugar, which are taken up by many cells throughout the body, fructose is almost exclusively broken down by the liver.
In the liver, fructose is converted into energy or stored as glycogen.
However, the liver can only store so much glycogen before excess amounts are turned into fat.
Large amounts of added sugar in the form of fructose overload your liver, leading to non-alcoholic fatty liver disease (NAFLD), a condition characterized by excessive fat buildup in the liver (
A study in over 5,900 adults showed that people who drank sugar-sweetened beverages daily had a 56% higher risk of developing NAFLD, compared to people who did not (
SUMMARYEating too much sugar may lead to NAFLD, a condition in which excessive fat builds up in the liver.
Aside from the risks listed above, sugar can harm your body in countless other ways.
Research shows that too much added sugar can:
- Increase kidney disease risk: Having consistently high blood sugar levels can cause damage to the delicate blood vessels in your kidneys. This can lead to an increased risk of kidney disease (
40 ). - Negatively impact dental health: Eating too much sugar can cause cavities. Bacteria in your mouth feed on sugar and release acid byproducts, which cause tooth demineralization (
41 ). - Increase the risk of developing gout: Gout is an inflammatory condition characterized by pain in the joints. Added sugars raise uric acid levels in the blood, increasing the risk of developing or worsening gout (
42 ). - Accelerate cognitive decline: High-sugar diets can lead to impaired memory and have been linked to an increased risk of dementia (43).
Research on the impact of added sugar on health is ongoing, and new discoveries are constantly being made.
SUMMARYConsuming too much sugar may worsen cognitive decline, increase gout risk, harm your kidneys and cause cavities.
Excessive added sugar has many negative health effects.
Although consuming small amounts now and then is perfectly healthy, you should try to cut back on sugar whenever possible.
Fortunately, simply focusing on eating whole, unprocessed foods automatically decreases the amount of sugar in your diet.
Here are some tips on how to reduce your intake of added sugars:
- Swap sodas, energy drinks, juices and sweetened teas for water or unsweetened seltzer.
- Drink your coffee black or use Stevia for a zero-calorie, natural sweetener.
- Sweeten plain yogurt with fresh or frozen berries instead of buying flavored, sugar-loaded yogurt.
- Consume whole fruits instead of sugar-sweetened fruit smoothies.
- Replace candy with a homemade trail mix of fruit, nuts and a few dark chocolate chips.
- Use olive oil and vinegar in place of sweet salad dressings like honey mustard.
- Choose marinades, nut butters, ketchup and marinara sauce with zero added sugars.
- Look for cereals, granolas and granola bars with under 4 grams of sugar per serving.
- Swap your morning cereal for a bowl of rolled oats topped with nut butter and fresh berries, or an omelet made with fresh greens.
- Instead of jelly, slice fresh bananas onto your peanut butter sandwich.
- Use natural nut butters in place of sweet spreads like Nutella.
- Avoid alcoholic beverages that are sweetened with soda, juice, honey, sugar or agave.
- Shop the perimeter of the grocery store, focusing on fresh, whole ingredients.
In addition, keeping a food diary is an excellent way of becoming more aware of the main sources of sugar in your diet.
The best way to limit your added sugar intake is to prepare your own healthy meals at home and avoid buying foods and drinks that are high in added sugar.
SUMMARYFocusing on preparing healthy meals and limiting your intake of foods that contain added sweeteners can help you cut back on the amount of sugar in your diet.
Eating too much added sugar can have many negative health effects.
An excess of sweetened foods and beverages can lead to weight gain, blood sugar problems and an increased risk of heart disease, among other dangerous conditions.
For these reasons, added sugar should be kept to a minimum whenever possible, which is easy when you follow a healthy diet based on whole foods.
If you need to cut added sugar from your diet, try some of the small changes listed above.
Before you know it, your sugar habit will be a thing of the past.
https://www.healthline.com/nutrition/how-much-sugar-per-day
Daily Intake of Sugar — How Much Sugar Should You Eat Per Day?
Added sugar is the single worst ingredient in the modern diet.
It provides calories with no added nutrients and can damage your metabolism in the long run.
Eating too much sugar is linked to weight gain and various diseases like obesity, type 2 diabetes and heart disease.
But how much is too much? Can you eat a little bit of sugar each day without harm, or should you avoid it as much as possible?

It is very important to make the distinction between added sugars and sugars that occur naturally in foods like fruits and vegetables.
These are healthy foods that contain water, fiber and various micronutrients. Naturally occurring sugars are absolutely fine, but the same does not apply to added sugar.
Added sugar is the main ingredient in candy and is abundant in many processed foods, such as soft drinks and baked products.
The most common added sugars are regular table sugar (sucrose) and high-fructose corn syrup.
If you want to lose weight and optimize your health, you should do your best to avoid foods that contain added sugars.
SUMMARYSugar that’s added to processed foods is much worse than natural sugar in whole foods like fruits and vegetables.
In 2008, people in the US were consuming over 60 pounds (28 kg) of added sugar per year — and this does not include fruit juices (
The average intake was 76.7 grams per day, which equals 19 teaspoons or 306 calories.
According to this study, sugar consumption went down by 23% between the years 2000 and 2008, mainly because people drank fewer sugar-sweetened beverages.
However, current intake levels are still way too high and probably haven’t changed since then. In 2012, the average adult intake was 77 grams per day (
Excess sugar consumption has been associated with obesity, type 2 diabetes, heart disease, certain cancers, tooth decay, non-alcoholic fatty liver disease and a lot more (3,
SUMMARYExcessive sugar intake is common. It’s been linked with various lifestyle diseases, including obesity, type 2 diabetes and heart disease.
Unfortunately, there is no simple answer to this question. Some people can eat a lot of sugar without harm, while others should avoid it as much as possible.
According to the American Heart Association (AHA), the maximum amount of added sugars you should eat in a day are (
- Men: 150 calories per day (37.5 grams or 9 teaspoons)
- Women: 100 calories per day (25 grams or 6 teaspoons)
To put that into perspective, one 12-oz can of Coke contains 140 calories from sugar, while a regular-sized Snickers bar contains 120 calories from sugar.
In contrast, the US dietary guidelines advise people to limit their intake to less than 10% of their daily calorie intake. For a person eating 2,000 calories per day, this would equal 50 grams of sugar, or about 12.5 teaspoons (
If you are healthy, lean and active, these seem like reasonable amounts. You’ll probably burn off these small amounts of sugar without them causing you any harm.
But it’s important to note that there is no need for added sugars in the diet. The less you eat, the healthier you will be.
SUMMARYThe American Heart Association advises men to get no more than 150 calories from added sugar per day and women no more than 100 calories.
If you are overweight, obese or diabetic, you should probably avoid sugar as much as possible.
In that case, you should not be consuming sugar every day, more like once per week or once every two weeks (at most).
But if you want to be as healthy as possible, you really shouldn’t be consuming foods that have sugar added to them.
Soft drinks, baked goods and processed foods have no place in the diet of someone who is overweight.
Stick to real, single-ingredient foods and avoid processed foods high in sugar and refined carbohydrates.
SUMMARYOverweight or obese people should avoid eating added sugar every day. If possible, it would be best to avoid all added sugar.
Sugary junk foods stimulate the same areas in the brain as drugs of abuse (
For this reason, sugar can cause people to lose control over their consumption.
That said, sugar is not nearly as addictive as drugs of abuse, and “sugar addiction” should be comparatively easy to overcome.
If you have a history of binge eating, failure at setting rules about your eating (like cheat meals or days) and repeated failures with the “everything in moderation” approach, then perhaps you are addicted.
In the same way that a smoker needs to avoid cigarettes completely, a sugar addict needs to avoid sugar completely.
Complete abstinence is the only reliable way for true addicts to overcome their addiction.
SUMMARYIf you feel like you are addicted to added sugar, you should consider avoiding it completely.
Avoid these foods, in order of importance:
- Soft drinks: Sugar-sweetened beverages are unhealthy. You should avoid these like the plague.
- Fruit juices: Fruit juices actually contain the same amount of sugar as soft drinks! Choose whole fruit instead of fruit juice.
- Candies and sweets: You should drastically limit your consumption of sweets.
- Baked goods: Cookies, cakes, etc. These tend to be very high in sugar and refined carbohydrates.
- Fruits canned in syrup: Choose fresh fruits instead.
- Low-fat or diet foods: Foods that have had the fat removed from them are often very high in sugar.
Drink water instead of soda or juices and don’t add sugar to your coffee or tea.
Instead of sugar in recipes, you can try things like cinnamon, nutmeg, almond extract, vanilla, ginger or lemon.
Just be creative and find recipes online. You can eat an endless variety of amazing foods even if you eliminate all sugar from your diet.
A natural, zero-calorie alternative to sugar is stevia.
SUMMARYReduce your sugar intake by limiting soft drinks, fruit juice, candy, and baked goods.
The best way to cut back on sugar is to simply avoid processed foods and satisfy your sweet tooth with fruit instead.
This approach doesn’t require math, calorie counting or obsessively reading food labels all the time.
However, if you’re simply unable to stick to unprocessed foods for financial reasons, then here are some tips on how to make the right choices:
- Know that sugar has many names. These include sugar, sucrose, high-fructose corn syrup (HFCS), dehydrated cane juice, fructose, glucose, dextrose, syrup, cane sugar, raw sugar, corn syrup and more.
- If a packaged food contains sugar in the first 3 ingredients, avoid it.
- If a packaged food contains more than one type of sugar, avoid it.
- Be aware that other high-sugar foods often labeled healthy fall into the same category. These include agave, honey, organic cane sugar and coconut sugar.
Warning: You MUST read nutrition labels! Even foods disguised as “health foods” can be loaded with added sugars.
SUMMARYIf you eat processed, packaged foods, avoiding all added sugar can be difficult. Make sure to read labels and be aware that food producers often disguise added sugar using alternative names.
At the end of the day, it’s important to figure out the sugar intake that’s right for you.
Some people can handle a little bit of sugar in their diet, while for others it causes cravings, binge eating, rapid weight gain and disease.
Every individual is unique and you need to figure out what works for you.
https://www.health.harvard.edu/heart-health/the-sweet-danger-of-sugar
The sweet danger of sugar
Too much added sugar can be one of the greatest threats to cardiovascular disease. Here's how to curb your sweet habit.
Sugar has a bittersweet reputation when it comes to health. Sugar occurs naturally in all foods that contain carbohydrates, such as fruits and vegetables, grains, and dairy. Consuming whole foods that contain natural sugar is okay. Plant foods also have high amounts of fiber, essential minerals, and antioxidants, and dairy foods contain protein and calcium.
Since your body digests these foods slowly, the sugar in them offers a steady supply of energy to your cells. A high intake of fruits, vegetables, and whole grains also has been shown to reduce the risk of chronic diseases, such as diabetes, heart disease, and some cancers.
Consuming too much sugar
However, problems occur when you consume too much added sugar — that is, sugar that food manufacturers add to products to increase flavor or extend shelf life.
In the American diet, the top sources are soft drinks, fruit drinks, flavored yogurts, cereals, cookies, cakes, candy, and most processed foods. But added sugar is also present in items that you may not think of as sweetened, like soups, bread, cured meats, and ketchup.
The result: we consume way too much added sugar. Adult men take in an average of 24 teaspoons of added sugar per day, according to the National Cancer Institute. That's equal to 384 calories.
"Excess sugar's impact on obesity and diabetes is well documented, but one area that may surprise many men is how their taste for sugar can have a serious impact on their heart health," says Dr. Frank Hu, professor of nutrition at the Harvard T.H. Chan School of Public Health.
Impact on your heart
In a study published in 2014 in JAMA Internal Medicine, Dr. Hu and his colleagues found an association between a high-sugar diet and a greater risk of dying from heart disease. Over the course of the 15-year study, people who got 17% to 21% of their calories from added sugar had a 38% higher risk of dying from cardiovascular disease compared with those who consumed 8% of their calories as added sugar.
"Basically, the higher the intake of added sugar, the higher the risk for heart disease," says Dr. Hu.
How sugar actually affects heart health is not completely understood, but it appears to have several indirect connections. For instance, high amounts of sugar overload the liver. "Your liver metabolizes sugar the same way as alcohol, and converts dietary carbohydrates to fat," says Dr. Hu. Over time, this can lead to a greater accumulation of fat, which may turn into fatty liver disease, a contributor to diabetes, which raises your risk for heart disease.
Consuming too much added sugar can raise blood pressure and increase chronic inflammation, both of which are pathological pathways to heart disease. Excess consumption of sugar, especially in sugary beverages, also contributes to weight gain by tricking your body into turning off its appetite-control system because liquid calories are not as satisfying as calories from solid foods. This is why it is easier for people to add more calories to their regular diet when consuming sugary beverages.
"The effects of added sugar intake — higher blood pressure, inflammation, weight gain, diabetes, and fatty liver disease — are all linked to an increased risk for heart attack and stroke," says Dr. Hu.
How much is okay?
If 24 teaspoons of added sugar per day is too much, then what is the right amount? It's hard to say, since sugar is not a required nutrient in your diet. The Institute of Medicine, which sets Recommended Dietary Allowances, or RDAs, has not issued a formal number for sugar.
However, the American Heart Association suggests that men consume no more than 150 calories (about 9 teaspoons or 36 grams) of added sugar per day. That is close to the amount in a 12-ounce can of soda.
Subtracting added sugar
Reading food labels is one of the best ways to monitor your intake of added sugar. Look for the following names for added sugar and try to either avoid, or cut back on the amount or frequency of the foods where they are found:
- brown sugar
- corn sweetener
- corn syrup
- fruit juice concentrates
- high-fructose corn syrup
- honey
- invert sugar
- malt sugar
- molasses
- syrup sugar molecules ending in "ose" (dextrose, fructose, glucose, lactose, maltose, sucrose).
Total sugar, which includes added sugar, is often listed in grams. Note the number of grams of sugar per serving as well as the total number of servings. "It might only say 5 grams of sugar per serving, but if the normal amount is three or four servings, you can easily consume 20 grams of sugar and thus a lot of added sugar," says Dr. Hu.
Also, keep track of sugar you add to your food or beverages. About half of added sugar comes from beverages, including coffee and tea. A study in the May 2017 Public Health found that about two-thirds of coffee drinkers and one-third of tea drinkers put sugar or sugary flavorings in their drinks. The researchers also noted that more than 60% of the calories in their beverages came from added sugar.
Yet, Dr. Hu warns against being overzealous in your attempts to cut back on added sugar, as this can backfire. "You may find yourself reaching for other foods to satisfy your sweet cravings, like refined starches, such as white bread and white rice, which can increase glucose levels, and comfort foods high in saturated fat and sodium, which also cause problems with heart health," he says.
Where does your added sugar come from? | ||
Rank | Food group | Proportion of average intake |
1 | Soda/energy/sports drinks | 42.2% |
2 | Grain-based desserts | 11.9% |
3 | Fruit drinks | 8.5% |
4 | Dairy desserts | 5.5% |
5 | Candy | 5.0% |
6 | Ready-to-eat cereals | 2.9% |
7 | Sugars/honey | 4.1% |
8 | Tea | 3.8% |
9 | Yeast breads | 2.3% |
10 | Syrups/toppings | 1.4% |
Source: CDC, National Health and Nutrition Examination Survey, 2005–06. | ||
Image: © Juliasv/Getty Images

https://integrative-medicine.ca/how-sugar-fuels-oxidative-stress/

What is oxidative stress?
Oxidation, which occurs during a number of natural processes within the body including detoxification and immune response, produces unstable molecules known as “free radicals”. Free radicals are normal, and the healthy body is equipped to stabilize them with what we can think of as super-stable molecules: antioxidants. There is a simple way to visualize this. Picture a circle with a ring around it: this is your molecule. The ring– or outer shell– of the molecule has a certain number of electrons (particles with negative electric charges): picture them as little dots. Most molecules have an even number of electrons on their outer shell. These molecules are stable. Free radicals have an uneven number of electrons on their outer shell, making them unstable, and potentially damaging. But they want to join the ranks of the stable– and to accomplish this, they steal electrons from normal molecules, turning them into free radicals, and setting off a chaotic chain reaction.
So where do antioxidants come in? We described them above as being “super-stable”. Antioxidants are able to donate an electron to a free radical without losing their own stability.
Oxidative stress occurs when we have an imbalance: too many free radicals, and not enough antioxidants to combat them. Left to their own devices, free radicals cause damage to our cells.
Oxidative stress occurs and increases with essentially any stress, inside or outside of the body, physical or emotional. If this sounds extremely broad, well… it is. Brought on by factors including toxins, environmental pollutants, emotional stress, viruses, infections, and diet, oxidative stress has been linked to conditions from anxiety and depression (1) to chronic fatigue syndrome (2) to cardiovascular disease (3) and cancer (4). It is also one of the primary mechanisms involved in aging (5), and has been implicated in Alzheimer’s disease and dementia (6).
Where does sugar come in?
How exactly does sugar accelerate oxidative stress? Oxidation occurs during a number of specific processes. One of the times when oxidation happens is when our bodies are processing sugar. The more we eat sugar, the more oxidation occurs.
It is the mitochondria, the energy “powerhouses” within our cells, that use glucose (blood sugar) to produce energy. Free radicals are a natural byproduct of this process. Excess glucose = excess free radical production.
The liver, our body’s detoxification centre, can also become overwhelmed with a high intake of sugar. This leads to inflammation, which leads to the production of more free radicals.
One important example of the link between sugar, oxidative stress, and disease is what we see in type 2 diabetes.
Blood sugar (glucose) comes from the consumption of sugars and carbohydrates. We mentioned above that the mitochondria use glucose within our cells to produce energy. Before this process can happen, though, glucose needs to be able to enter our cells from the bloodstream. It is the hormone insulin that makes this happen. When our intake of sugar is too high, it overwhelms this system, and our cells’ response to insulin begins to fail. This means that we are left with all of this extra glucose hanging out in the bloodstream, wreaking havoc by increasing the production of free radicals, increasing inflammation, damaging our cells, and causing oxidative stress.
Insulin resistance develops and increases over time if this problem is not caught and solved early enough. Eventually, it develops into type 2 (insulin resistant) diabetes, and oxidative stress brought on in part by sugar is a major contributor (7).
Intake of sugar has also been linked many times over to the development of cardiovascular disease; research points to oxidative stress as one key mechanism in this process (8).
Beyond diabetes and cardiovascular disease, the list of illnesses that have been linked to oxidative stress is extensive and includes autoimmune disorders such as rheumatoid arthritis (9); neurodegenerative diseases (10); mental illnesses (11); and cancer (12).
How can I prevent this?
We’re not really going to give you an answer as simple as reducing your intake of sugar, are we? Yes. Cutting out sugar may not be a complete cure-all for oxidative stress or the conditions it contributes to, but it is a solid start, and a step that you can take NOW.
Other simple steps that you can take to increase antioxidant protection and reduce oxidative stress include avoiding hydrogenated fats, limiting intake of alcohol, choosing organic foods, and increasing intake of antioxidant foods (such as kale, berries, beets, ginger, green tea, nuts and seeds). If you believe that you’re in need of extra support, talk to your practitioner about antioxidant supplements including glutathione.
To book a consultation with Dr. Gannage, click here.
Web results
People also ask
Web results
https://www.mariarickerthong.com/baking-soda-and-health/
Diabetes and Cancer
Type 2 diabetes occurs when the body’s cells become insulin-resistant, so the pancreas, which produces insulin, has to make more and more insulin to keep stuffing our excess blood sugar into our cells.
Dr. Sircus writes that “the pancreas, an organ largely responsible for pH control, is one of the first organs affected when general pH shifts to the acidic” and that “once there is an inhibition of pancreatic function and pancreatic bicarbonate flow, there naturally follows a chain reaction of inflammatory reactions throughout the body”.
He also points out that heavy-metal toxicity, other toxic chemicals and radiation “will affect, weaken and destroy pancreatic tissues.” Interesting (at least to me)!
What’s even more interesting is what Dr. Sircus writes about cancer: “Cancer patients have a saliva pH of 4.5 to 5.5. Healthy people have a pH of 7.0 to 7.5.” He points out that way back in 1931, “Dr. Otto Warburg discovered that ‘to become malignant, cancer must have low oxygen, strong acid environment'”, so this is not new news, although it appears it’s been forgotten.
Acid Conditions Lead to Inflammation
So, here we have an underlying factor to the underlying factor of inflammation: acid conditions in the body. Not only that, but Dr. Sircus digs further to show us that this increased oxidative stress caused by free radicals, which is caused by an acidic condition, is especially dangerous to our mitochondria. Aha!
Mitochondrial dysfunction is beginning to be shown by researchers to be a common underlying issue in conditions ranging from autism to Parkinson’s, and I’m betting that it goes deeper than that: I’m betting it’s common in most, if not all, chronic diseases and conditions, which is, I believe, essentially what Dr. Sircus is getting at, too.
If I understand this correctly, then an acidic body condition => free-radical generation => oxidative stress => inflammation => mitochondrial dysfunction (in a nutshell).
So here’s a simplified, yet elegant, approach to understanding the nature of disease: an acidic body condition, which is brought about by our Standard American Diet (SAD), toxicity, especially from heavy metals, stressful lifestyles and radiation, such as from EMFs.
Not only does Dr. Sircus deliver this framework, but he also dives deeper into two diseases with growing rates of incidence: diabetes and cancer.
It drains farmers dry—literally
It takes 2.7 liters of water to make one liter of Coke, which is part of the reason that its bottling plants have been accused of hogging water that should go to farmers in poor areas of India and Latin America. In 2014, officials ordered a Coca-Cola plant to shut down because it was taking too much groundwater, and in 2017, traders boycotted sodas (including Coke and Pepsi) for using up too much water during a drought.
https://www.ncbi.nlm.nih.gov/pmc/articles/PMC5986486/
What happens in the body when you drink soda
Crack, fizz, gulp: Within the first 10 to 15 minutes of chugging that cola, your intestines mainline that sugar to your blood, spiking your blood sugar levels. That’s a ton of quick, fizzy energy, and to manage the onslaught, multiple organs in your body kick into overdrive so you can process that sugar. Soda companies don’t tell you everything either; these are the secrets Coca-Cola doesn’t want you to know.
Your pancreas chugs out insulin to help transport the sugar (which is a carbohydrate) to your muscles for energy. But that soda contains way more sugar than your muscles need. “When an individual drinks a 20-ounce soda, they are getting an entire meal’s carbohydrate load through liquid,” explains Meltem Zeytinoglu, MD, an endocrinologist and assistant professor of medicine at the University of Chicago Medicine, in Chicago, IL. “In most cases, this soda is consumed in addition to a meal, so the additional carbohydrates will need to be processed. This extra sugar, instead of being stored in muscle tissue, gets converted to fat in the liver.” According to a study in the Journal of Hepatology, regular soda intake is linked to a condition known as fatty liver disease. Sugar in soda might damage your brain, too.
Your kidney also comes into play by helping dump excess sugar through your urine. That means your body loses water, which, along with the diuretic effect of the caffeine in the soda, increases your risk of dehydration. The sugar and caffeine in soda is “quite the unhealthy combination,” says Dr. Zeytinoglu. Learn about more foods nutritionists never eat.

What happens in your brain when you drink soda
Then there’s the issue of one soda never really being enough: A study in the British Journal of Sports Medicine suggested that sugar and drugs of abuse have a lot in common when it comes to effects on brain chemistry and behavior.
The good news is you don’t have to banish sodas completely. “The most important thing to remember is that portion control matters,” says Cordialis Msora-Kasago, RDN, a spokesperson for the Academy of Nutrition and Dietetics in Los Angeles, CA. “An occasional soda is not going to have a significant impact on your health. It’s when it becomes a regular habit that [it’s] a problem. Look for other non-caloric beverages you enjoy, like iced tea, water, and infused waters.” And here are some more reasons to cut back on all soda (including diet).
What happens in the body when you drink soda
Crack, fizz, gulp: Within the first 10 to 15 minutes of chugging that cola, your intestines mainline that sugar to your blood, spiking your blood sugar levels. That’s a ton of quick, fizzy energy, and to manage the onslaught, multiple organs in your body kick into overdrive so you can process that sugar. Soda companies don’t tell you everything either; these are the secrets Coca-Cola doesn’t want you to know.
Your pancreas chugs out insulin to help transport the sugar (which is a carbohydrate) to your muscles for energy. But that soda contains way more sugar than your muscles need. “When an individual drinks a 20-ounce soda, they are getting an entire meal’s carbohydrate load through liquid,” explains Meltem Zeytinoglu, MD, an endocrinologist and assistant professor of medicine at the University of Chicago Medicine, in Chicago, IL. “In most cases, this soda is consumed in addition to a meal, so the additional carbohydrates will need to be processed. This extra sugar, instead of being stored in muscle tissue, gets converted to fat in the liver.” According to a study in the Journal of Hepatology, regular soda intake is linked to a condition known as fatty liver disease. Sugar in soda might damage your brain, too.
Your kidney also comes into play by helping dump excess sugar through your urine. That means your body loses water, which, along with the diuretic effect of the caffeine in the soda, increases your risk of dehydration. The sugar and caffeine in soda is “quite the unhealthy combination,” says Dr. Zeytinoglu. Learn about more foods nutritionists never eat.
What happens in your brain when you drink soda
Then there’s the issue of one soda never really being enough: A study in the British Journal of Sports Medicine suggested that sugar and drugs of abuse have a lot in common when it comes to effects on brain chemistry and behavior.
The good news is you don’t have to banish sodas completely. “The most important thing to remember is that portion control matters,” says Cordialis Msora-Kasago, RDN, a spokesperson for the Academy of Nutrition and Dietetics in Los Angeles, CA. “An occasional soda is not going to have a significant impact on your health. It’s when it becomes a regular habit that [it’s] a problem. Look for other non-caloric beverages you enjoy, like iced tea, water, and infused waters.” And here are some more reasons to cut back on all soda (including diet).


No comments:
Post a Comment
Note: Only a member of this blog may post a comment.